
Quick background
Hotjar is a Behavior Analytics software (SaaS - B2B) for online businesses.
Make it easy for Product Teams to go beyond traditional web analytics and understand what users are really doing on their site.
Business problem
Product teams create funnels and KPI dashboards in their (other) analytics products (GA, Amplitude, Mixpanel, etc) and then use Hotjar to try to understand why those metrics are (or not) moving.
Prospective customers for high-tier plans often didn’t choose Hotjar because we lacked a quantitative analytics suite unlike our competitors.
User problem
Users needing to do a lot of manual work outside of Hotjar in order to make sense of the product experience insights we offer.
Product teams feel our current dashboard is “useless” and lagging behind competitors.
The Goal
Empower product teams to easily connect the dots between their quantitative and qualitative data so they can find rich and truly meaningful insights (sum>parts!).
Product & Design Strategy
To align on a clear direction, I kicked off the project with the Product Manager and Tribe Lead, mapping knowns and unknowns and establishing a shared vision to inform the product strategy.
Digging deeper: Uncovering the Hidden Friction in Analytics
I conducted 10 in-depth interviews with power users to understand existing pain points. The core friction? Teams were spending excessive time manually stitching insights together across tools.
Digging deeper, I led exploratory research into general analytics usage, running 9 more interviews with PMs, Product Designers, and UX Researchers, where we uncovered that traditional analytics platforms favored technical users—alienating designers and researchers. This insight revealed a key opportunity: make analytics more inclusive and actionable across disciplines.
Through a card sorting exercises, we were able to identify key data points to provide to users and help with prioritization.
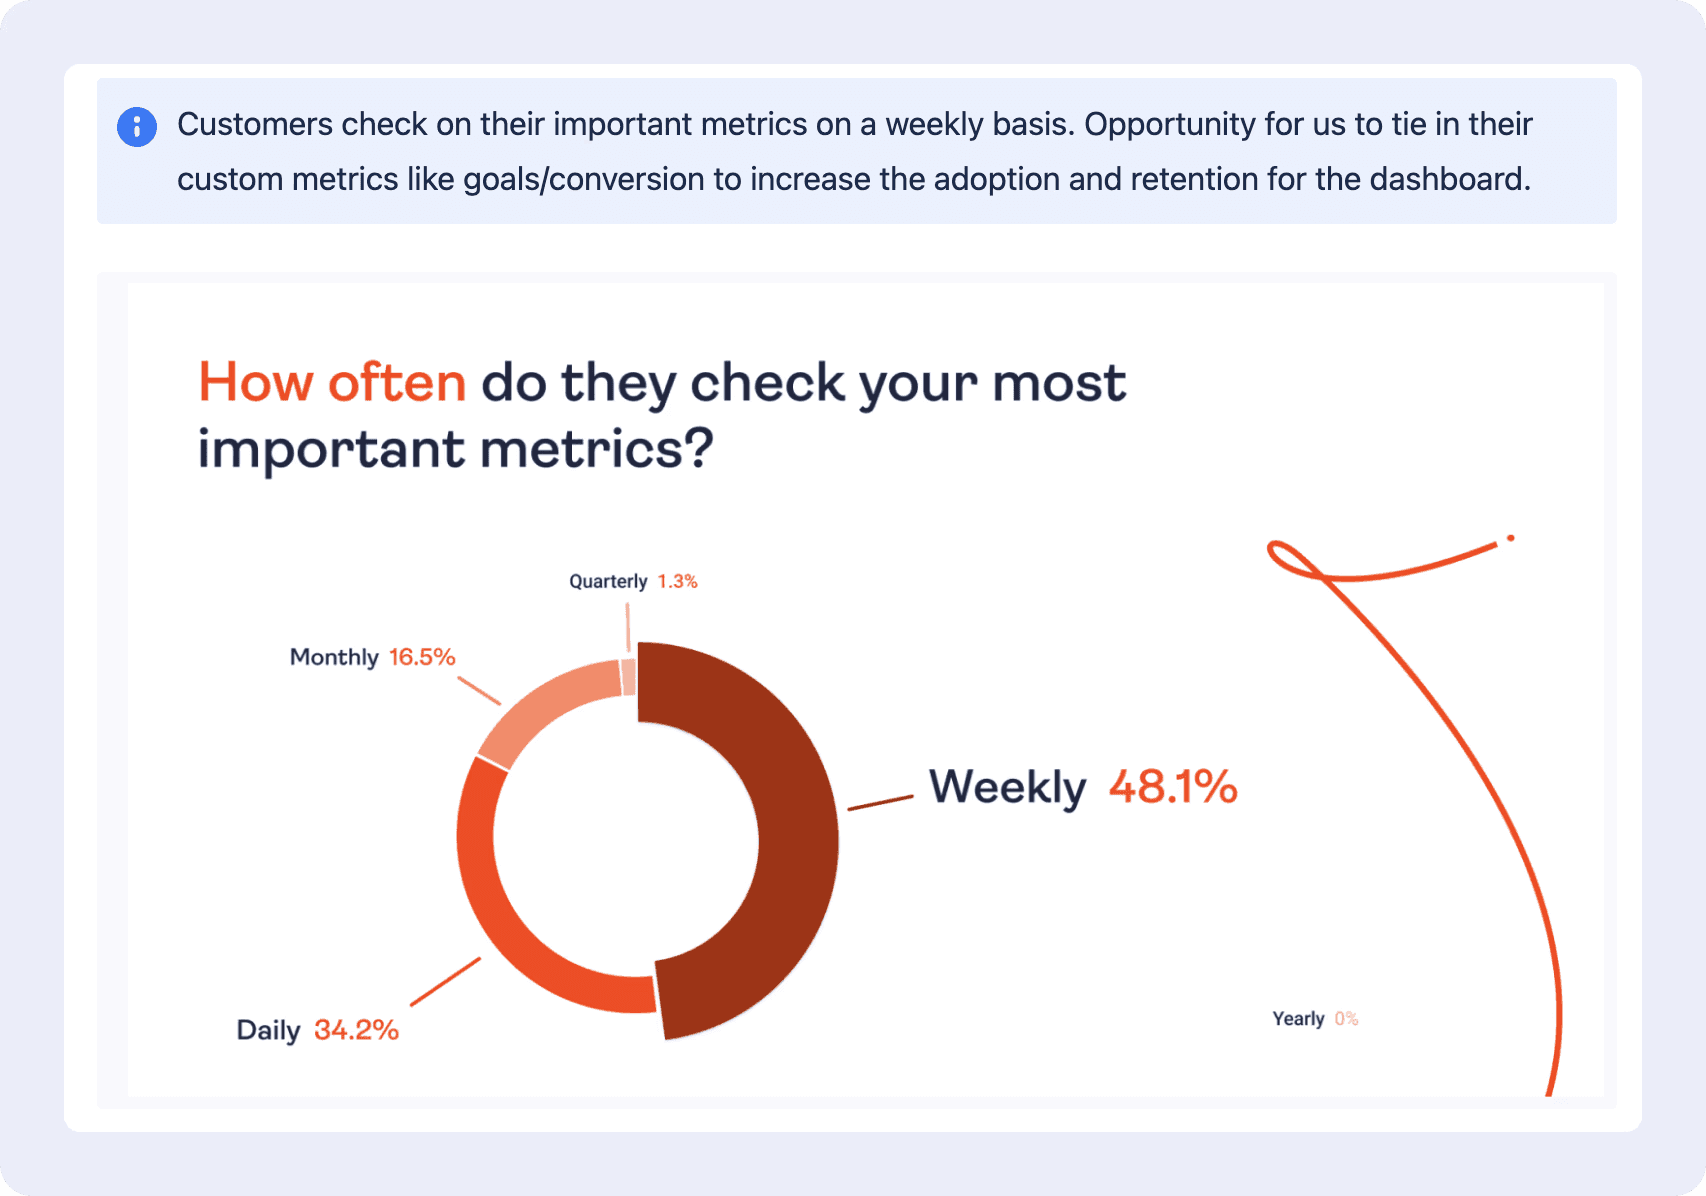
Sample of a research artifact from the discovery project…

Aligning the Organization
With early findings in hand, I worked to gain alignment across the different squads. I presented insights, addressed risks like data sampling issues and dashboard overlap, and ensured stakeholders were on board with the direction.
From Ideas to Solutions
Partnering with the PM, I facilitated ideation sessions to sketch high-level concepts. I then translated those ideas into early wireframes and interactive prototypes, which were user tested and later iterated with input from the wider UX design tribe.
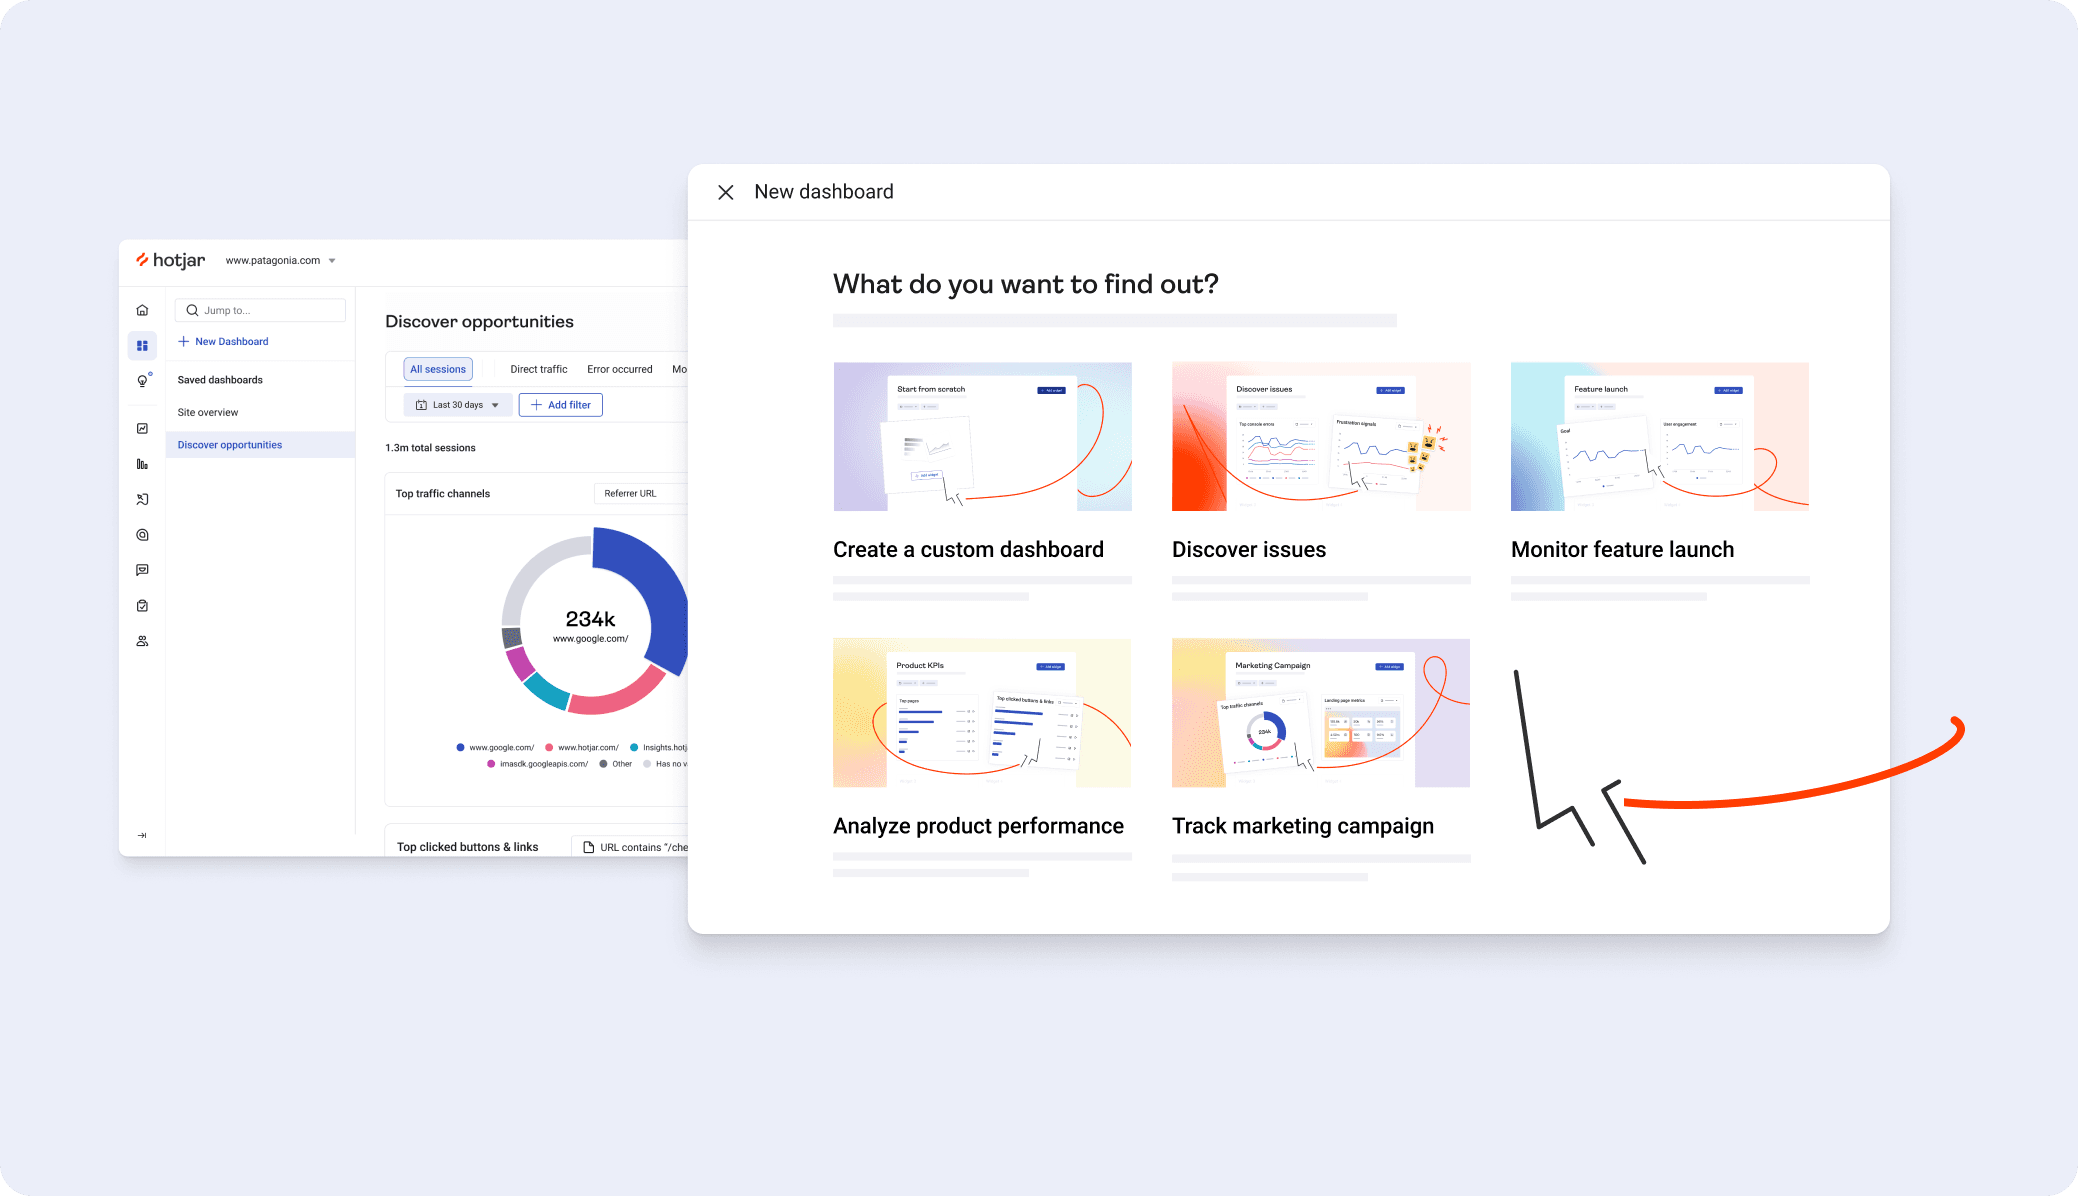
MVP Launch ✅
The result was a real-time Dashboard MVP—surfacing insights such as user sentiment, top pages, rage clicks, U-turns, returning session trends, etc.
This helped reduce the time required to find insights and became a gateway to other tools like Recordings and Heatmaps. The dashboard launch laid the groundwork for cross-tool discovery—making behavioral data more accessible across the organization.

Learning & Iteration Loop
We didn’t stop at launch. We built a continuous discovery pipeline, where we added a feedback link directly into the dashboard, triggering a survey with both UMUX-Lite metrics and custom questions on analytics habits and struggles.
Survey responses streamed into a Slack channel for team visibility, and users could optionally schedule 1:1 interviews. This led to 1–3 interviews per week for 6+ months.
We used these sessions in two ways:
Live usability sessions where users shared screens to expose pain points.
Prototype testing to validate custom dashboard concepts and new features.
Insights were stored in Dovetail, where we tagged, clipped, and shared highlights for cross-functional prioritization. Mixpanel data was used to validate behavioral patterns, and opportunity mapping helped us spot recurring themes and make data-backed roadmap decisions.


Scaling & Enabling Others
Working as a trio (PM, Engineering Lead, and myself), I introduced a version story map to break product launches into visual, digestible phases—helping both engineers and product marketing plan ahead with clarity.
Beyond our squad, I created Dashboard Contribution Guidelines to allow other teams to build and plug in widgets using reusable components—ensuring consistency and scale across Hotjar’s tool ecosystem.
I also worked closely with Product Marketing, inviting them to interviews, sharing research insights, and supporting with visuals to shape product launch narratives.

Follow Up Iterations/Features
Features that emerged from the continuous research, prioritized accordingly.
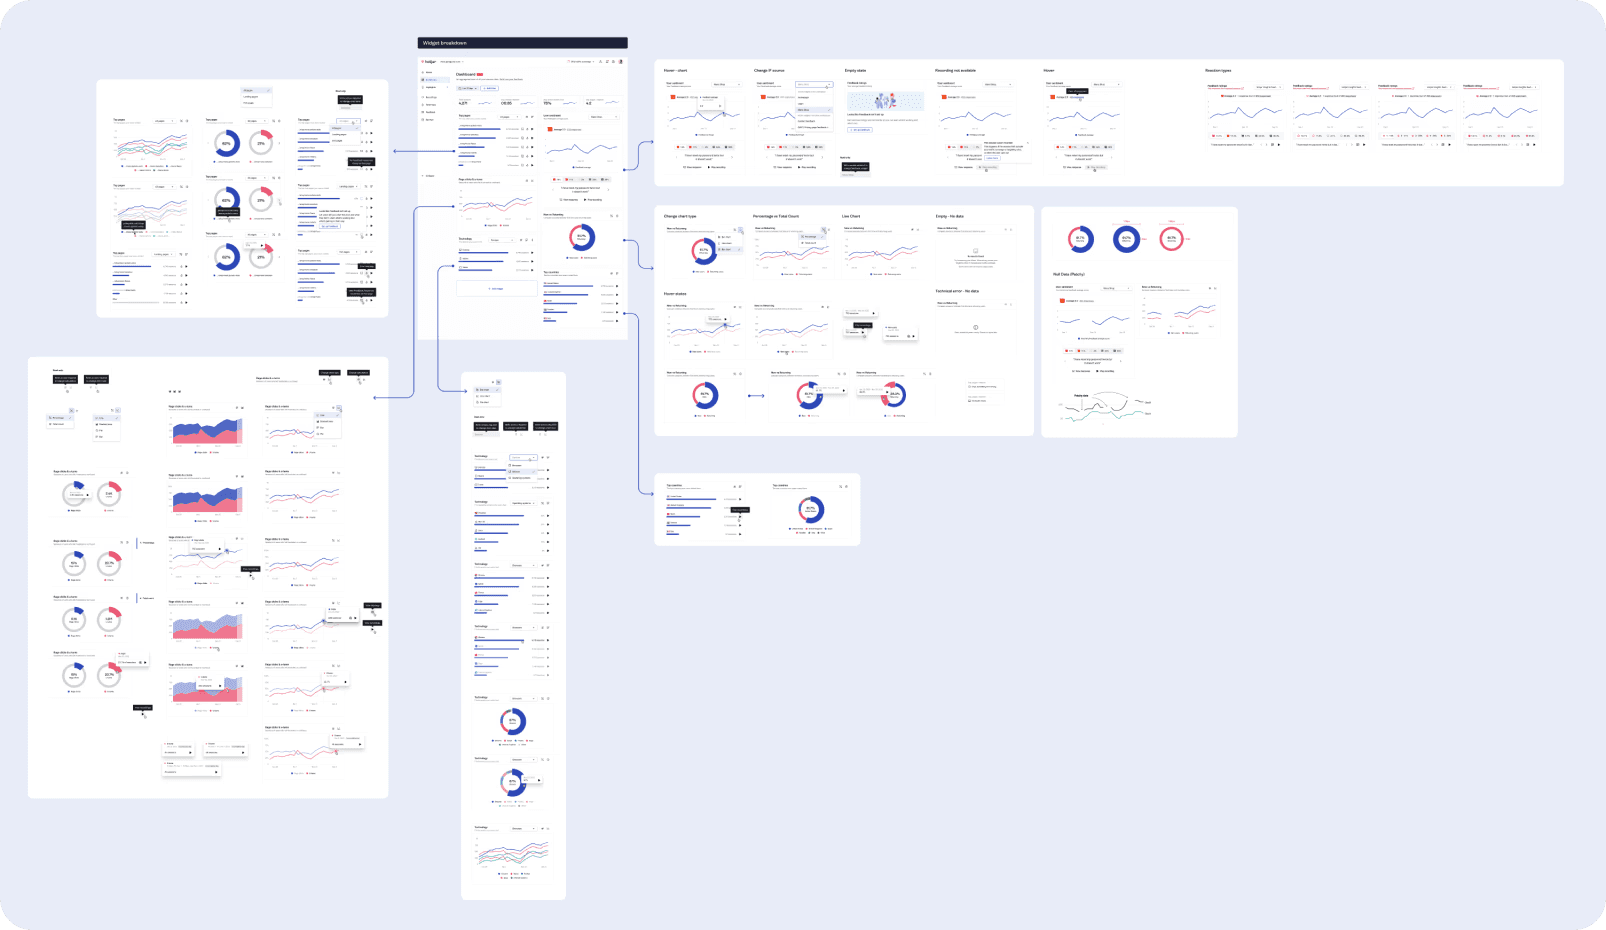
Custom Dashboards
Trends
Funnels
Multiple Dashboards
Use-case dashboards
AI Powered Dashboards
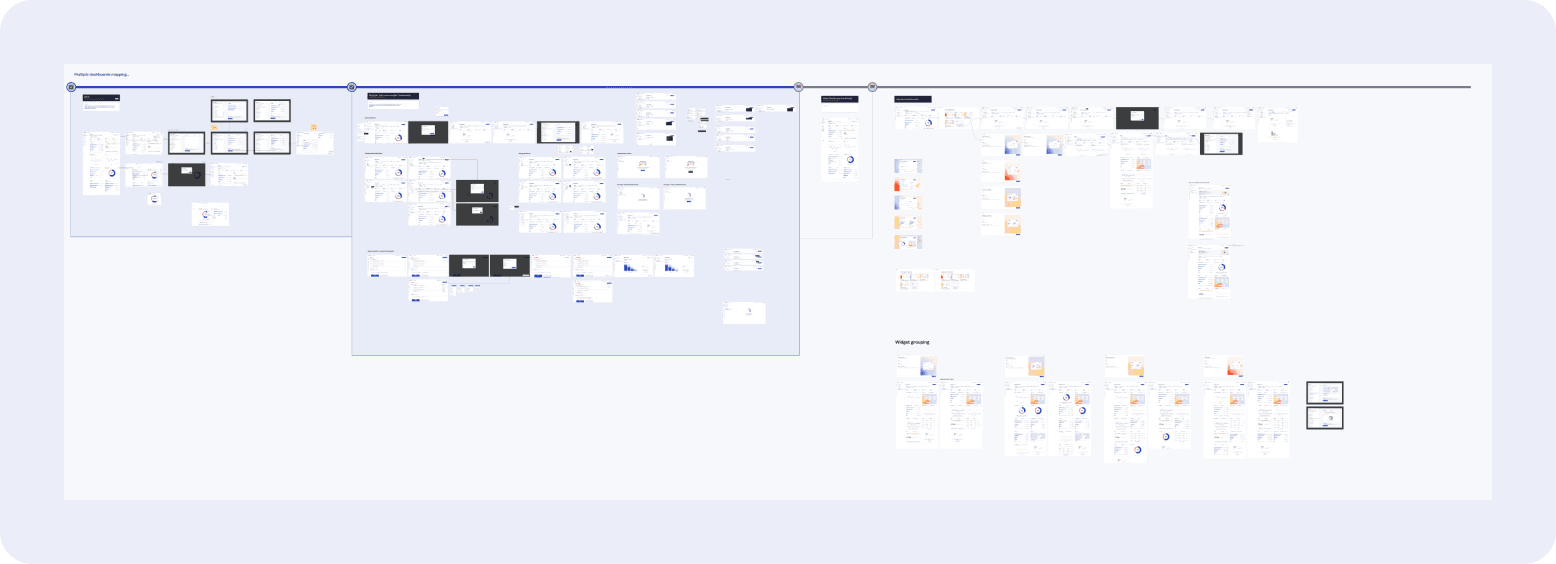
Sitemap Mapping
Use-case Dashboard creation based on JTBD research:
Iterated version of the dashboard based on the continuous research:

Product high-level sitemap (hackathon):


