Hotjar · SaaS
0 to 1, product development – The end-to-end design process from concept to production, bringing product analytics to Hotjar to empower product teams to easily connect the dots between their quantitative & qualitative data so they can find meaningful insights.
Results
The Dashboard became the 2nd most used tool in Hotjar.
Funnels was the highest (75%) contributor to the monetization of Hotjar's highest paid plan contributing millions in MRR (monthly recurring revenue).

Hotjar was historically used alongside analytics tools to analyze why metrics moved, using screen recordings, heatmaps, and feedback tools. However, user interviews revealed that users had to do a lot of manual work to understand product experience insights. To align with our strategy of providing meaningful and actionable insights, I led the introduction of product analytics, transforming Hotjar from a partner tool to a comprehensive analytics platform. including a dashboard, funnels, and a trends product. The Dashboard became the second most used at Hotjar and Funnels generated millions in monthly recurring revenue.
Responsibilities
User interviews, card sorting, surveys, facilitate workshop, design, prototype & validation testing.
Launched · Duration
March 2022 · ≈ 6 months Total (Design/research ≈ 3 months)
Stakeholders
Product Manager, Group Product Lead, Tribe Design Lead, engineers & a another designer from the tribe.
Tools
Figma, Miro, Google Meet, Mixpanel, Hotjar, Dovetail, Lyssna, Confluence, Calendly
Hotjar is a Behavior Analytics software (SaaS - B2B) for online businesses.
Make it easy for them to go beyond traditional web analytics and understand what users are really doing on their site.
I worked with the (trio) Product Manager and engineering team lead to define the scope of the project and map the roadmap using story-mapping to help the team deliver the MUP (minimum usable product).
Led the discovery and design efforts, including the user interface design and contributing new components to the design system.
Product teams create funnels and KPI dashboards in their (other) analytics products (GA, Amplitude, Mixpanel, etc) and then use Hotjar to try to understand why those metrics are (or not) moving.
Prospective customers for high-tier plans often don’t choose Hotjar because we lack a quantitative analytics suite unlike our competitors.
Users needing to do a lot of manual work outside of Hotjar in order to make sense of the product experience insights we offer.
Product teams feel our current dashboard is “useless” and lagging behind competitors.


Mid-market Product teams, focussing on:
Product Managers
UX/Product Designers
UX Researchers.
Making analytics accessible to all roles within a product team, not just analytical users.
Staying true to Hotjar's core value of being "intuitive to it's core", making analytics as simple and easy to use as possible.
Change the current perception from a partner to bringing analytics to Hotjar users
Discovery Phase
Kick off session with the Product Manager & Tribe Lead to gather what we know thus far and agree on next steps to come up with a vision to inform the product strategy.
Conducted 10 in-depth user interviews with ICP power users
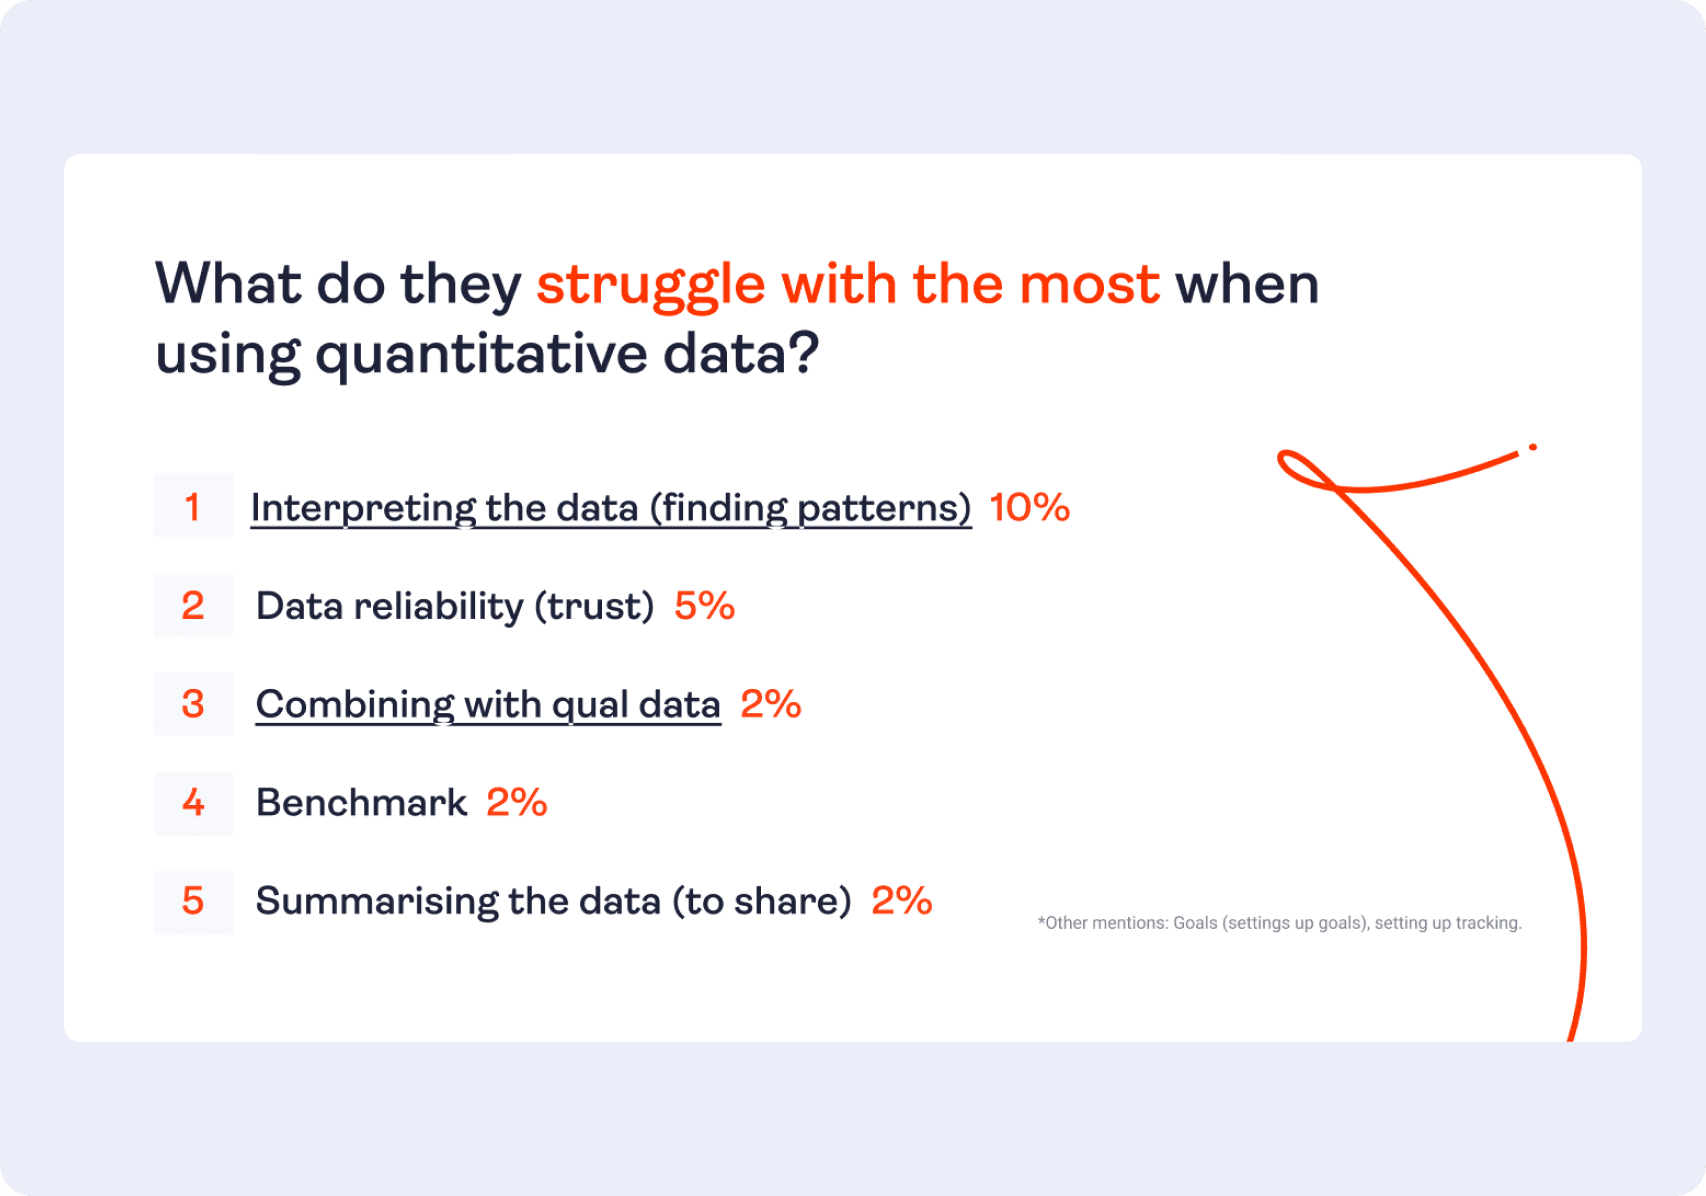
Identified user pain points: manual work required to make sense of product experience insights
Discovered opportunity to make analytics accessible to all roles within product teams


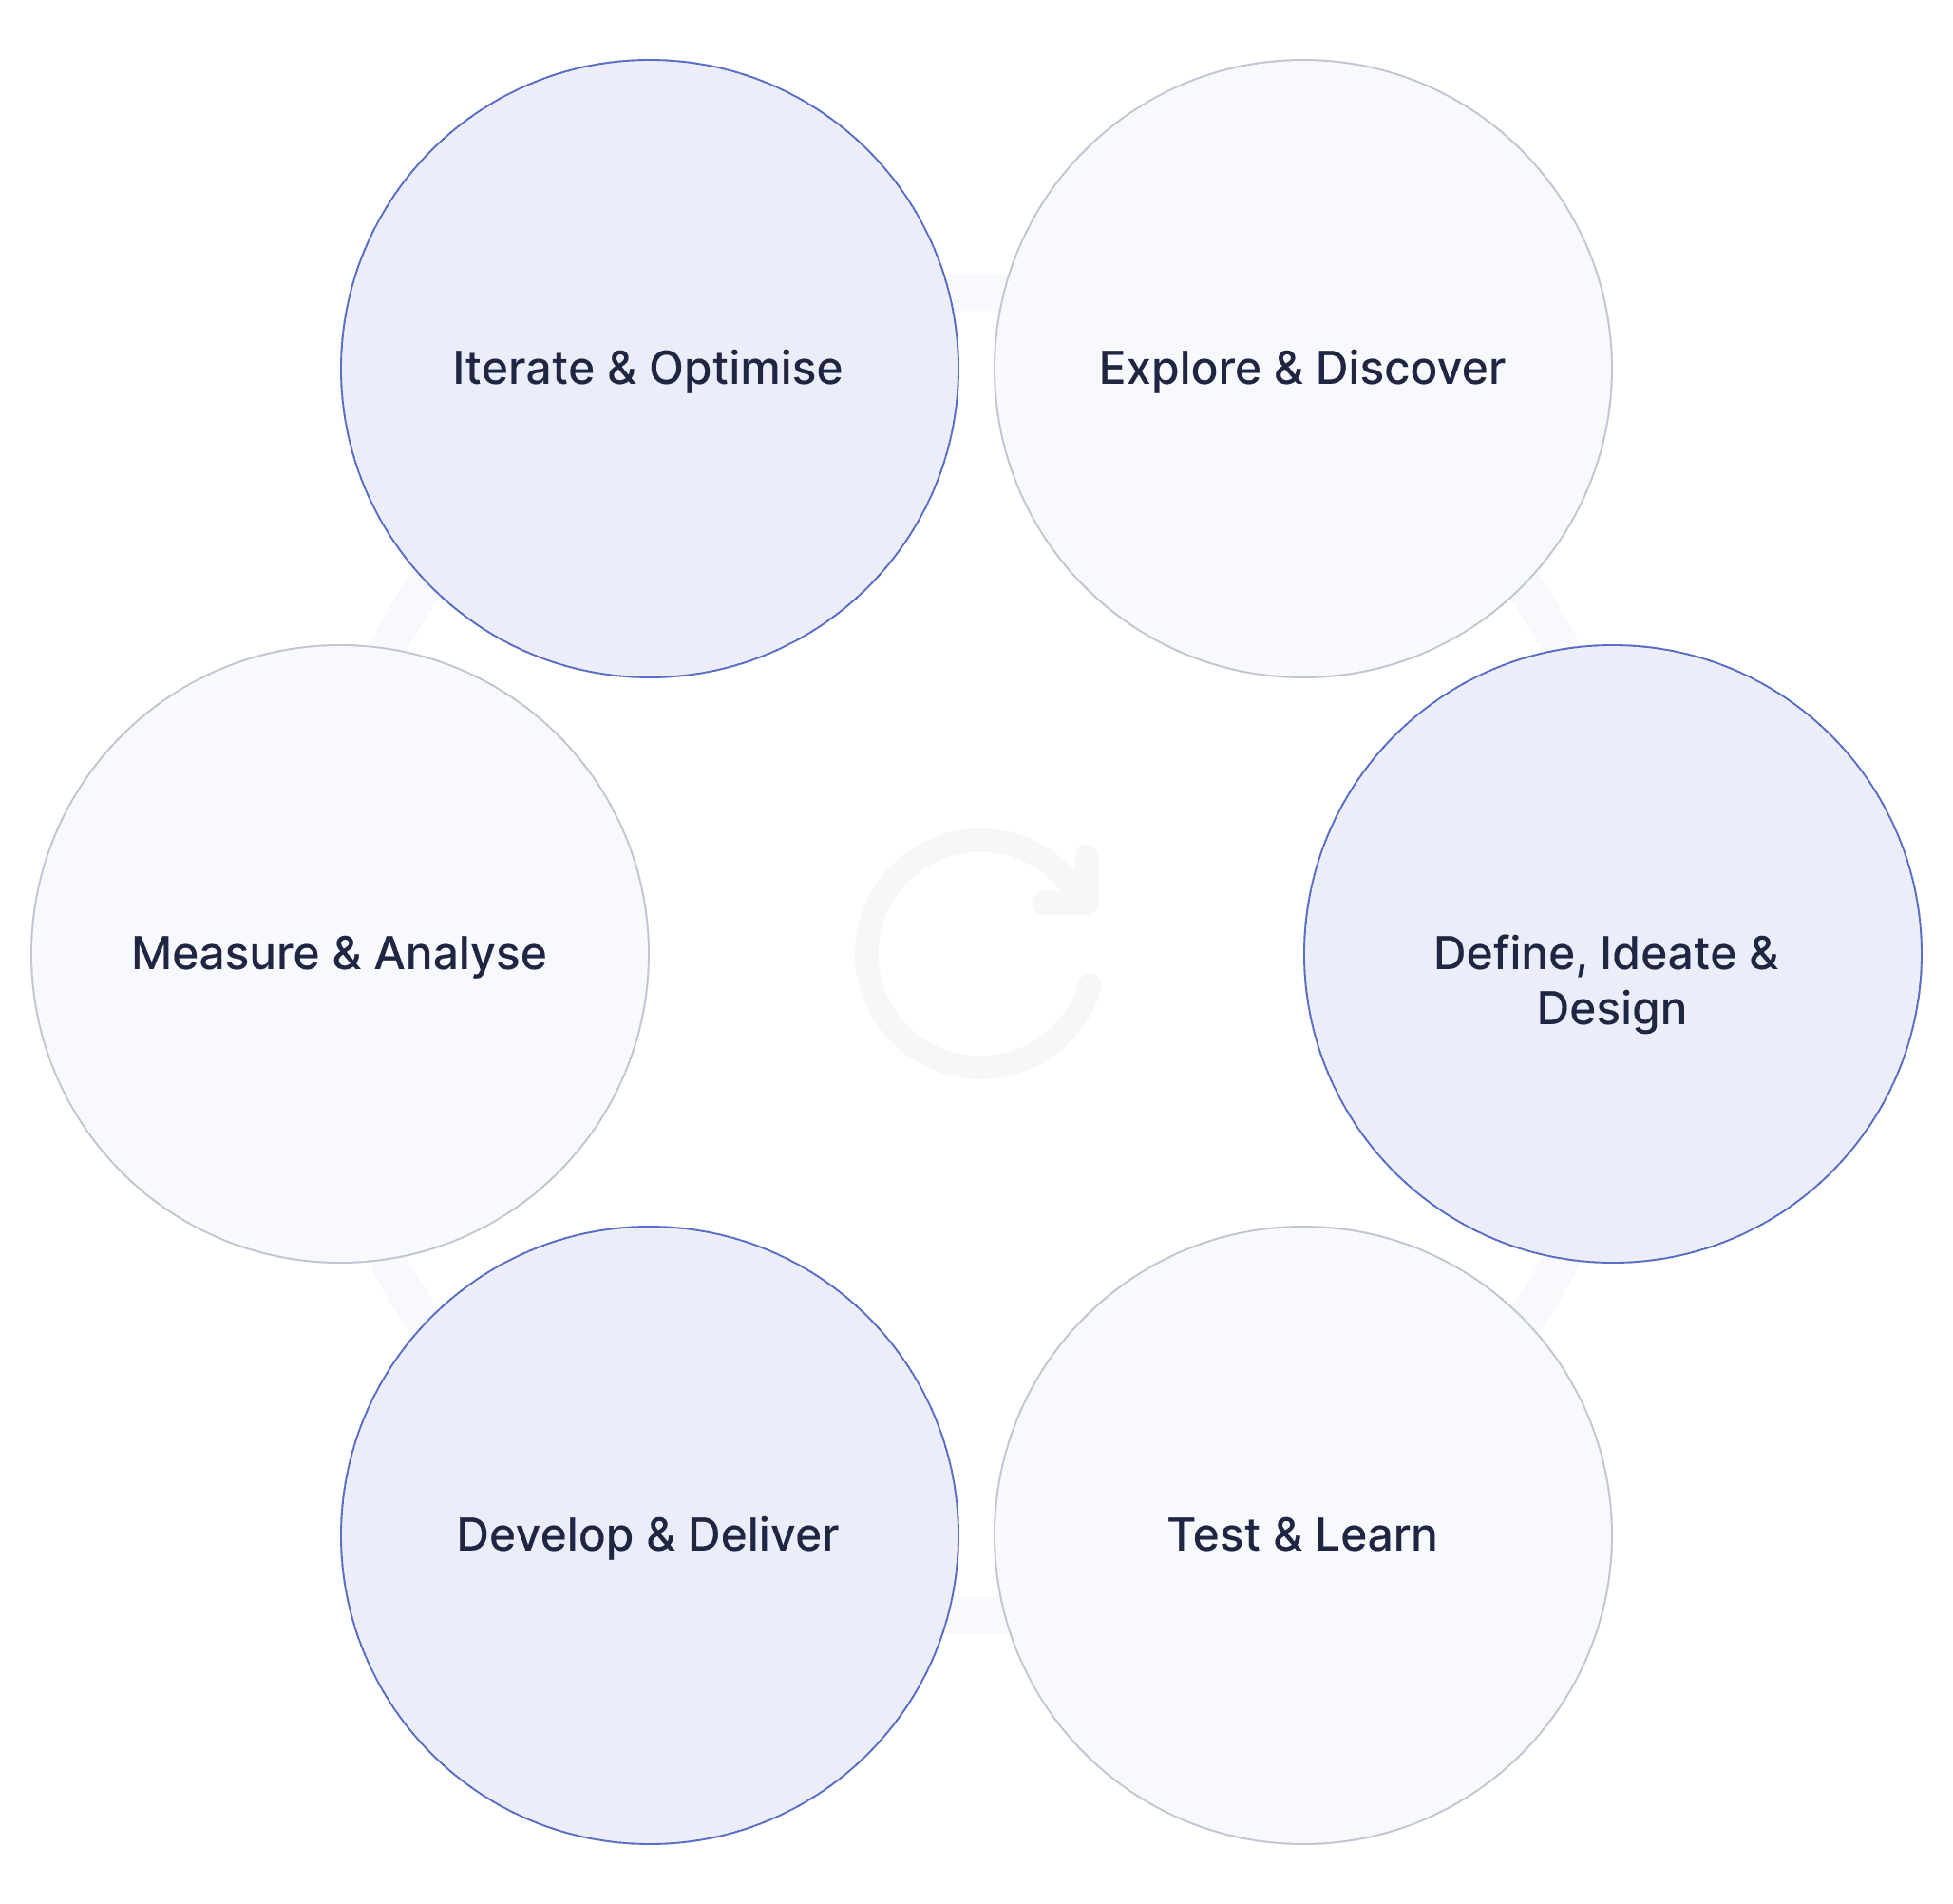
Design Process
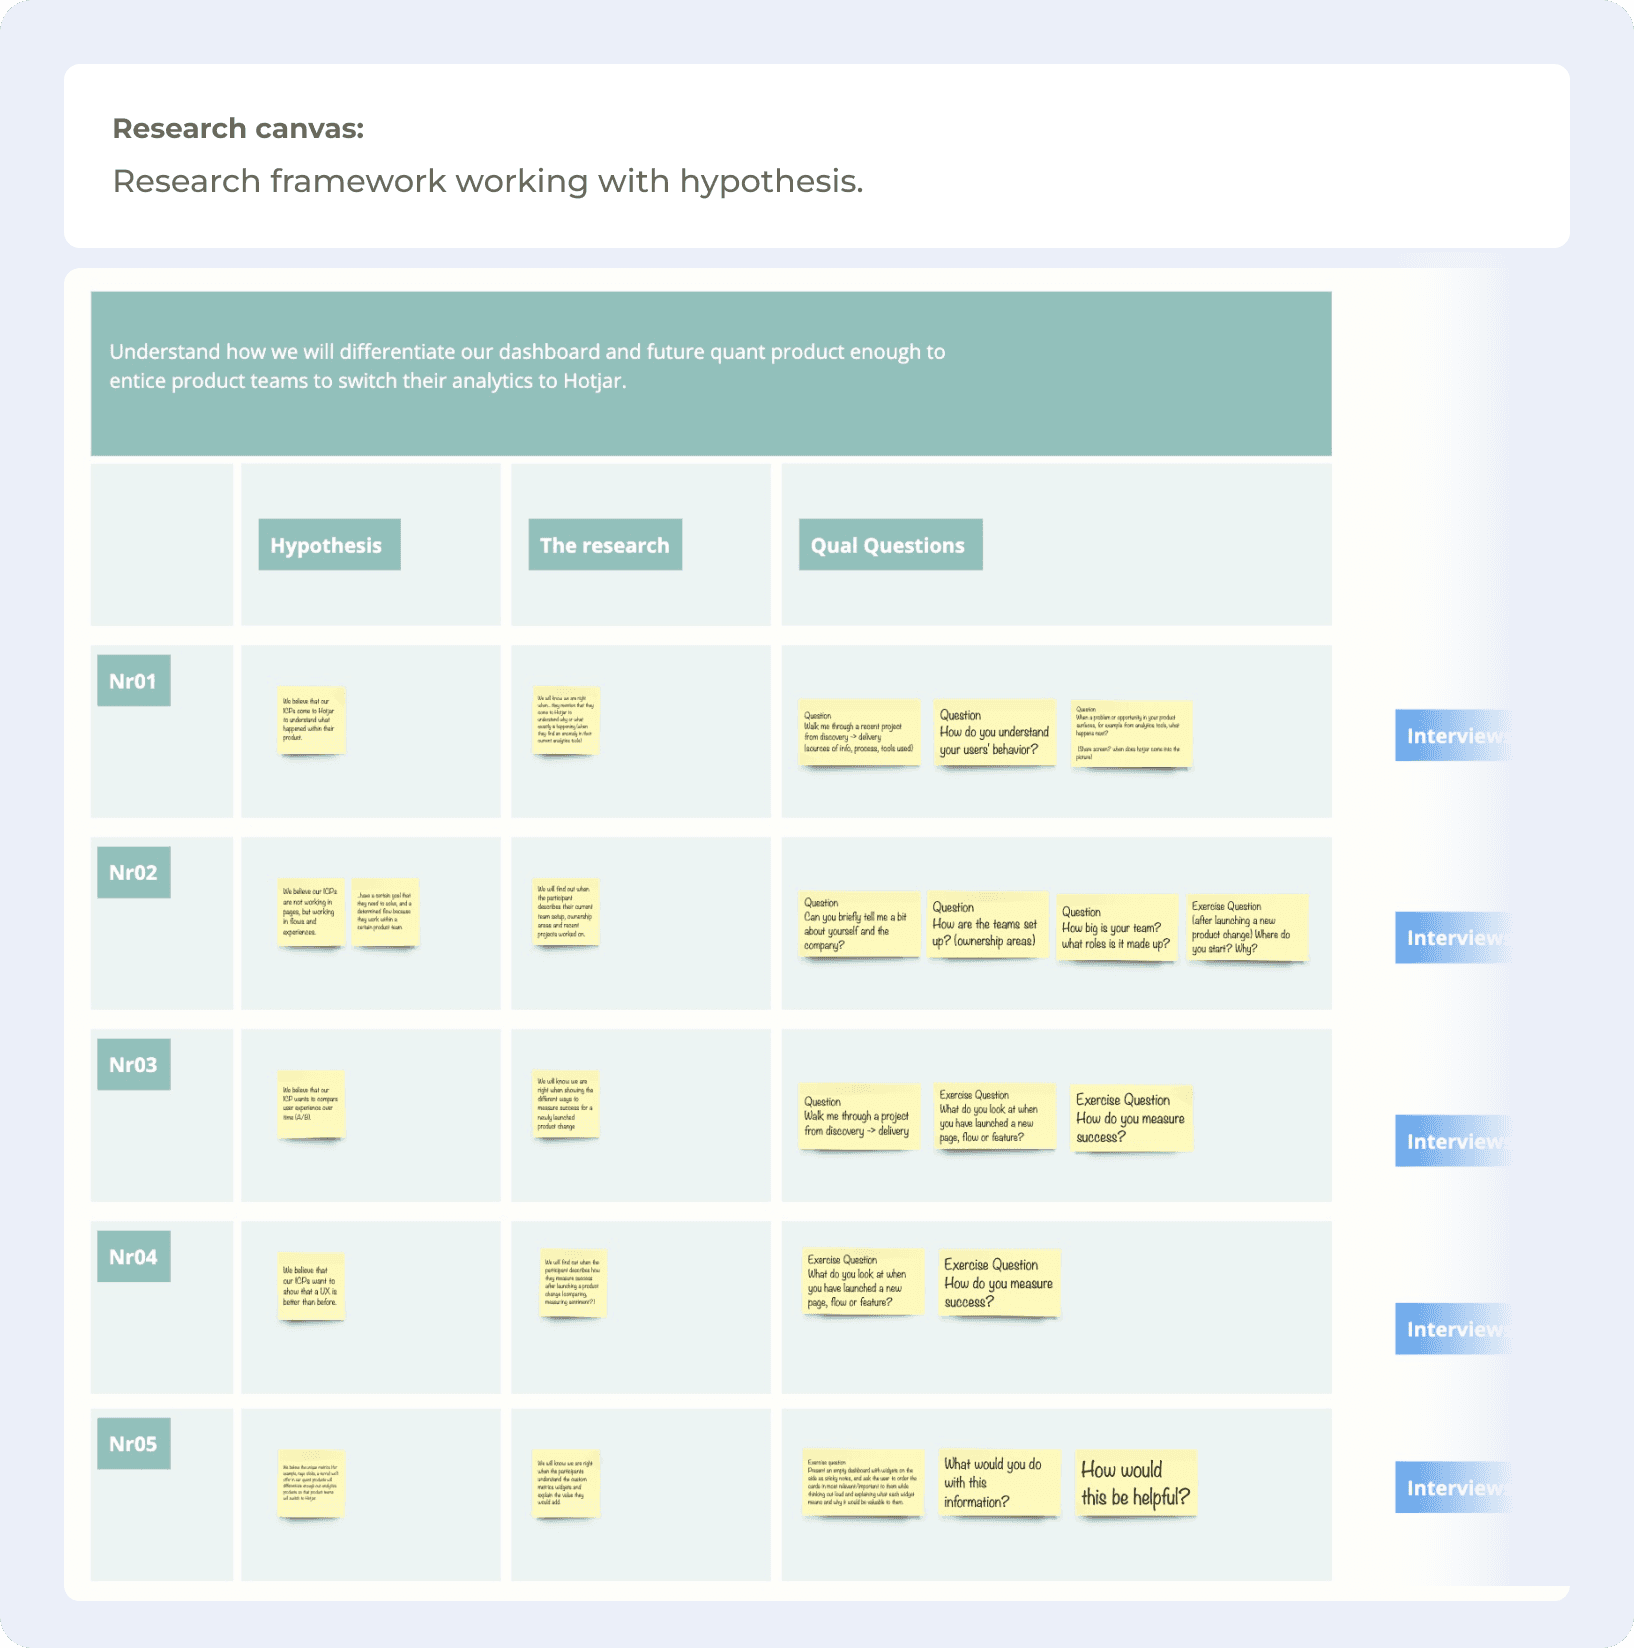
Conducted 9 in-depth user interviews with ICPs (PMs, PDs, UXRs)
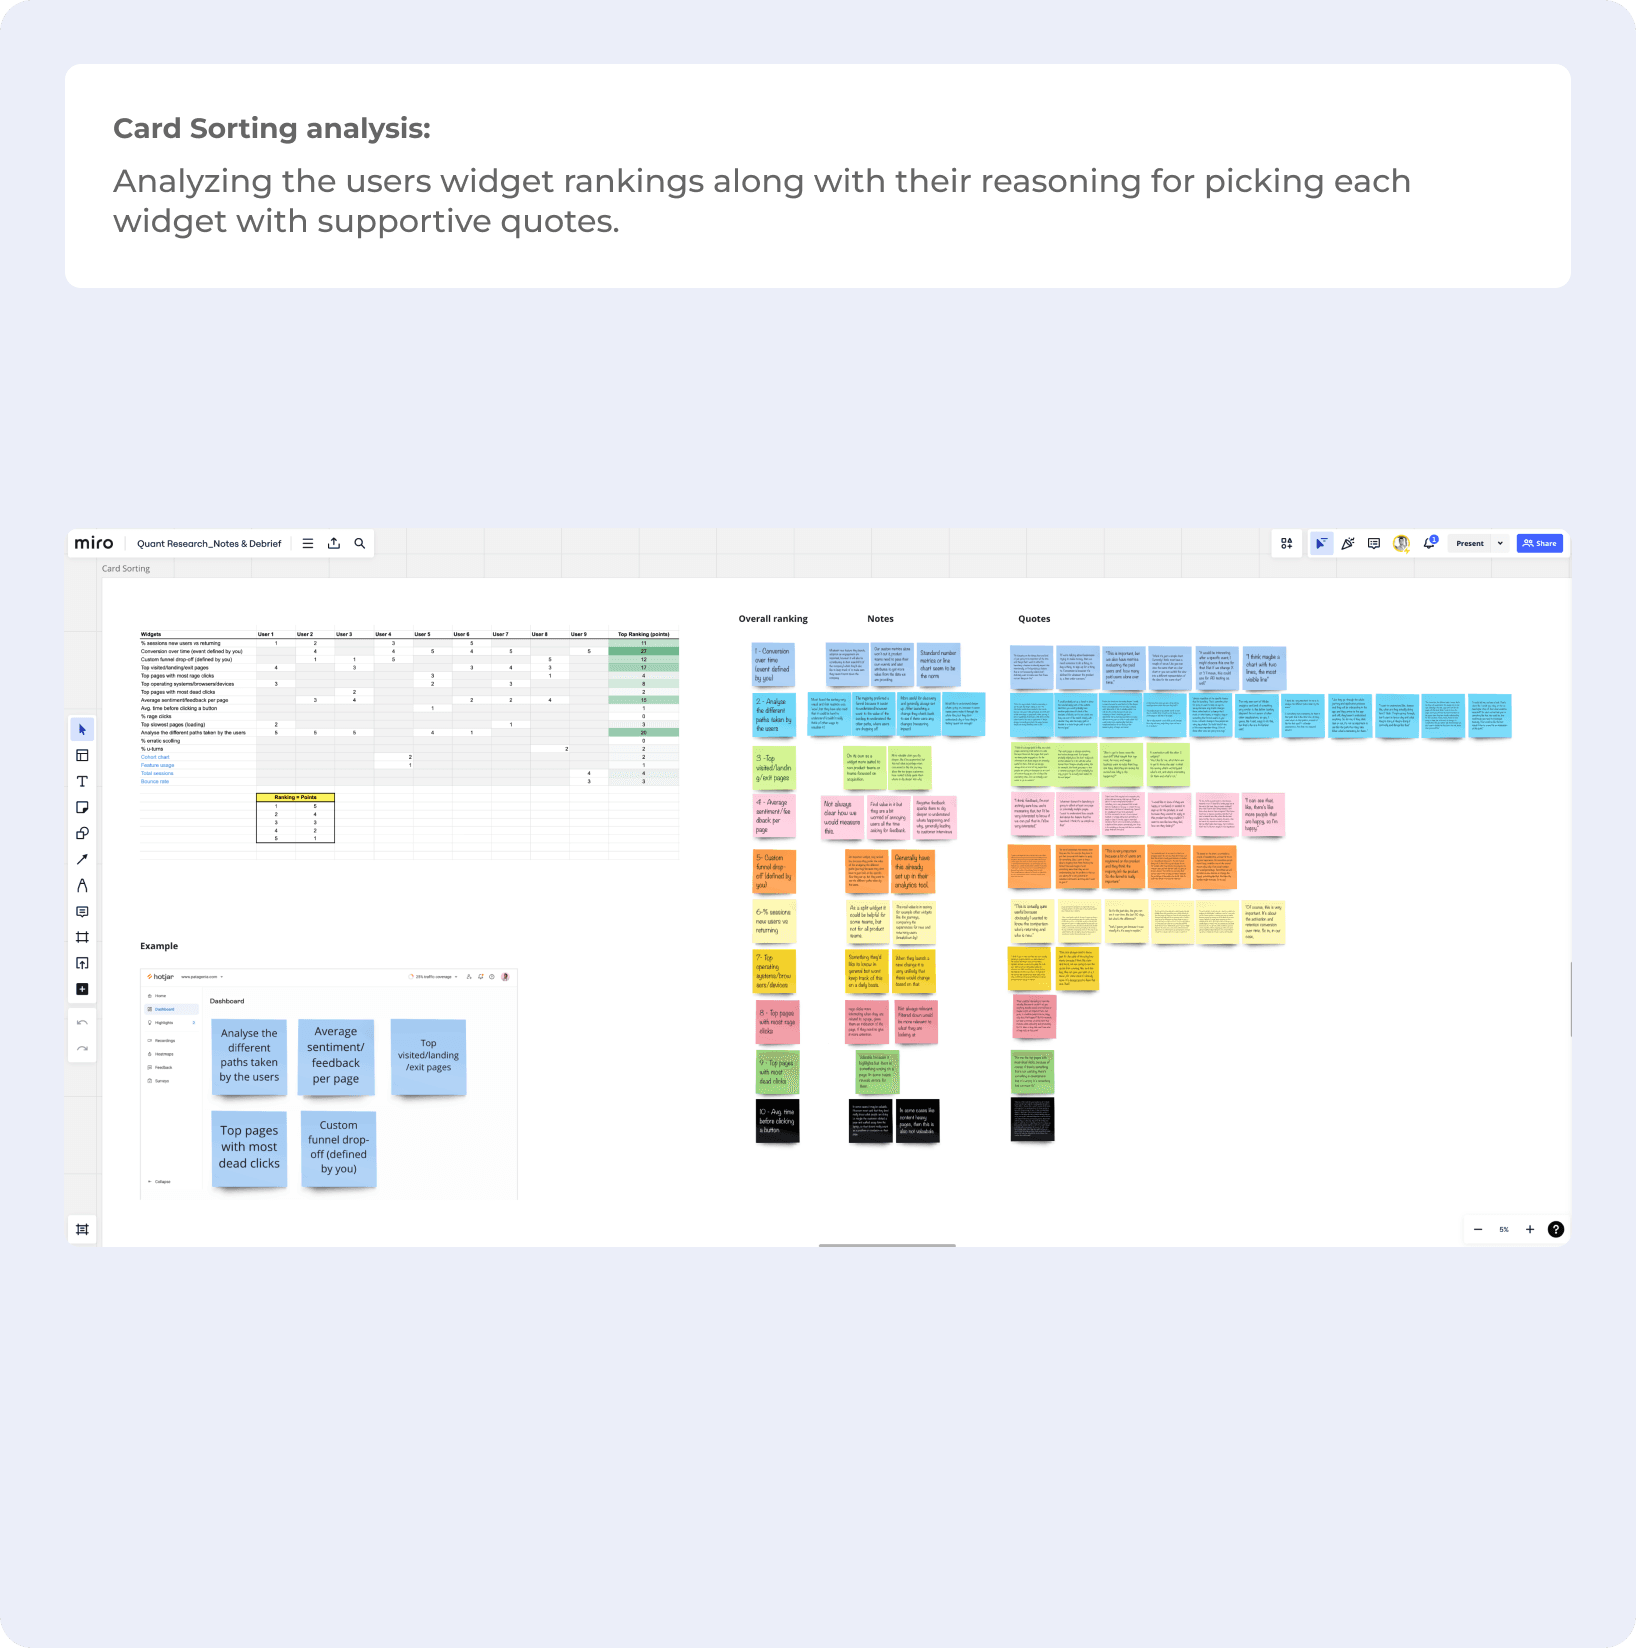
Utilized card sorting exercises to understand information hierarchy & prioritization
Key Insight: Traditional analytics tools are geared towards analytical people, not designers or researchers


Stakeholder Alignment
Shared insights and got buy-in from different squads
Addressed risks and challenges, such as data sampling issues and existing dashboard conflicts
Ideation and Prototyping
Facilitated brainstorming sessions with PM to explore high-level wireframes
Created early prototypes for validation testing
Iterated based on feedback from tribe UX designers
Designing the UI & Interactions
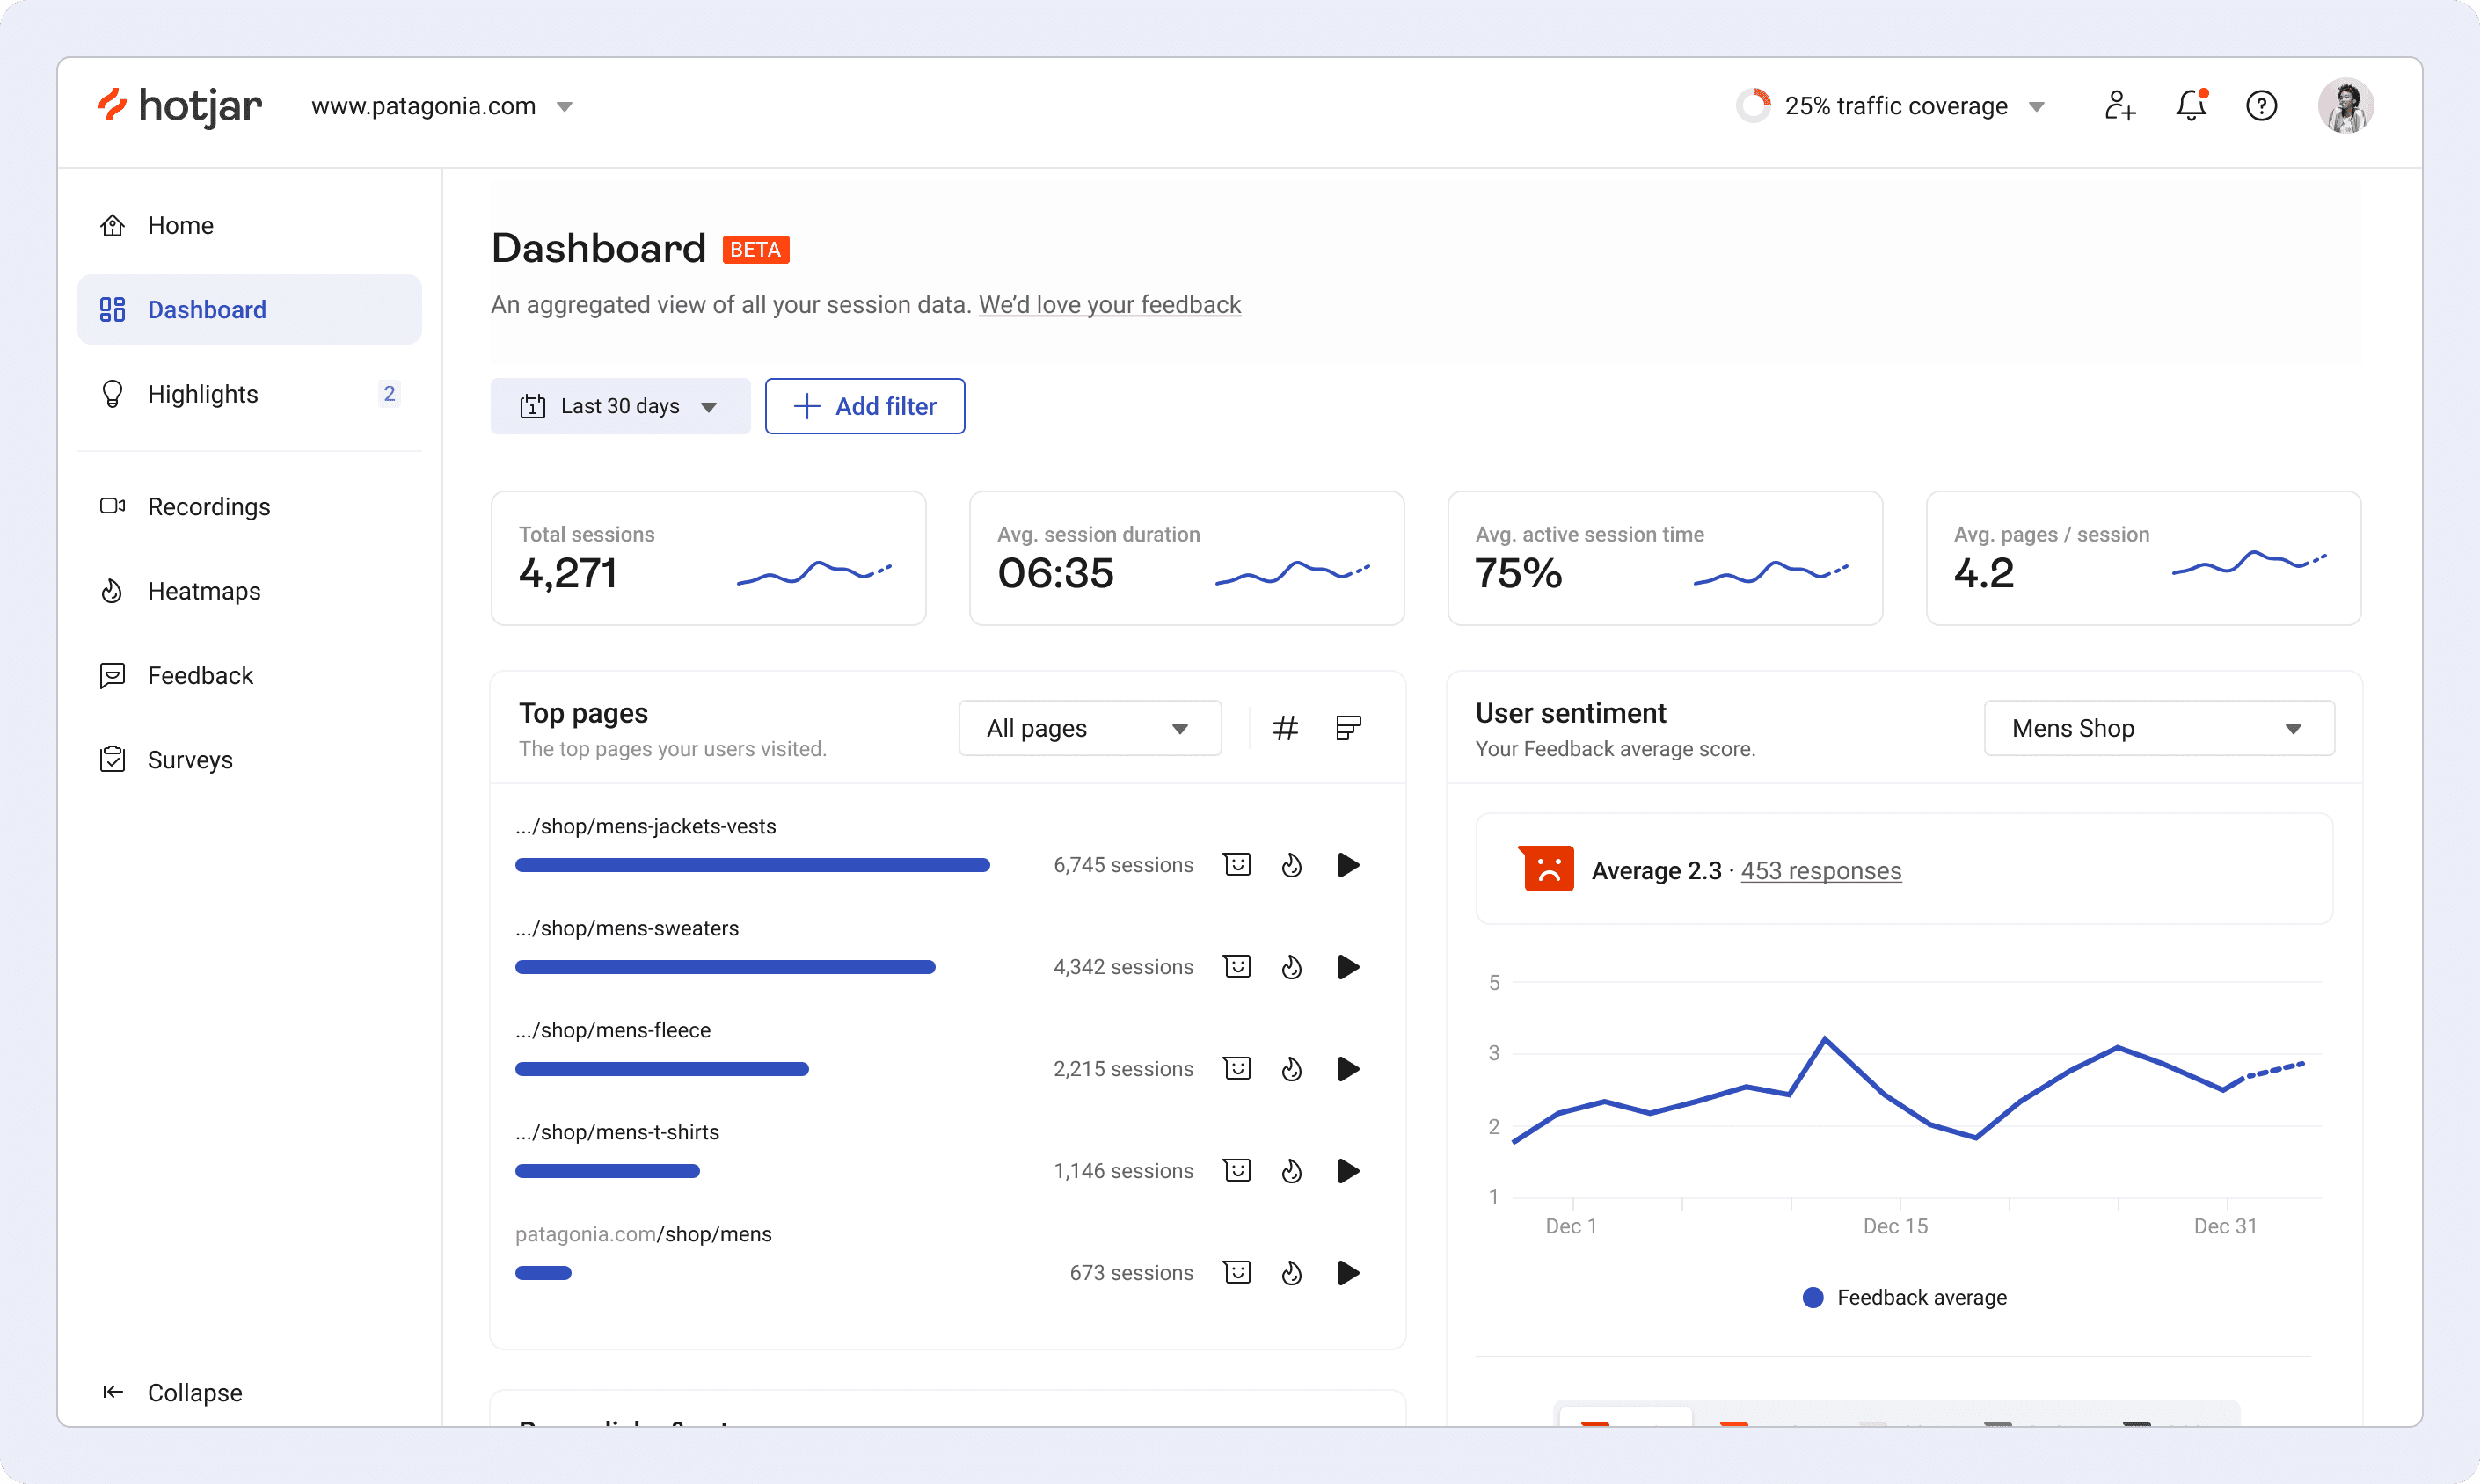
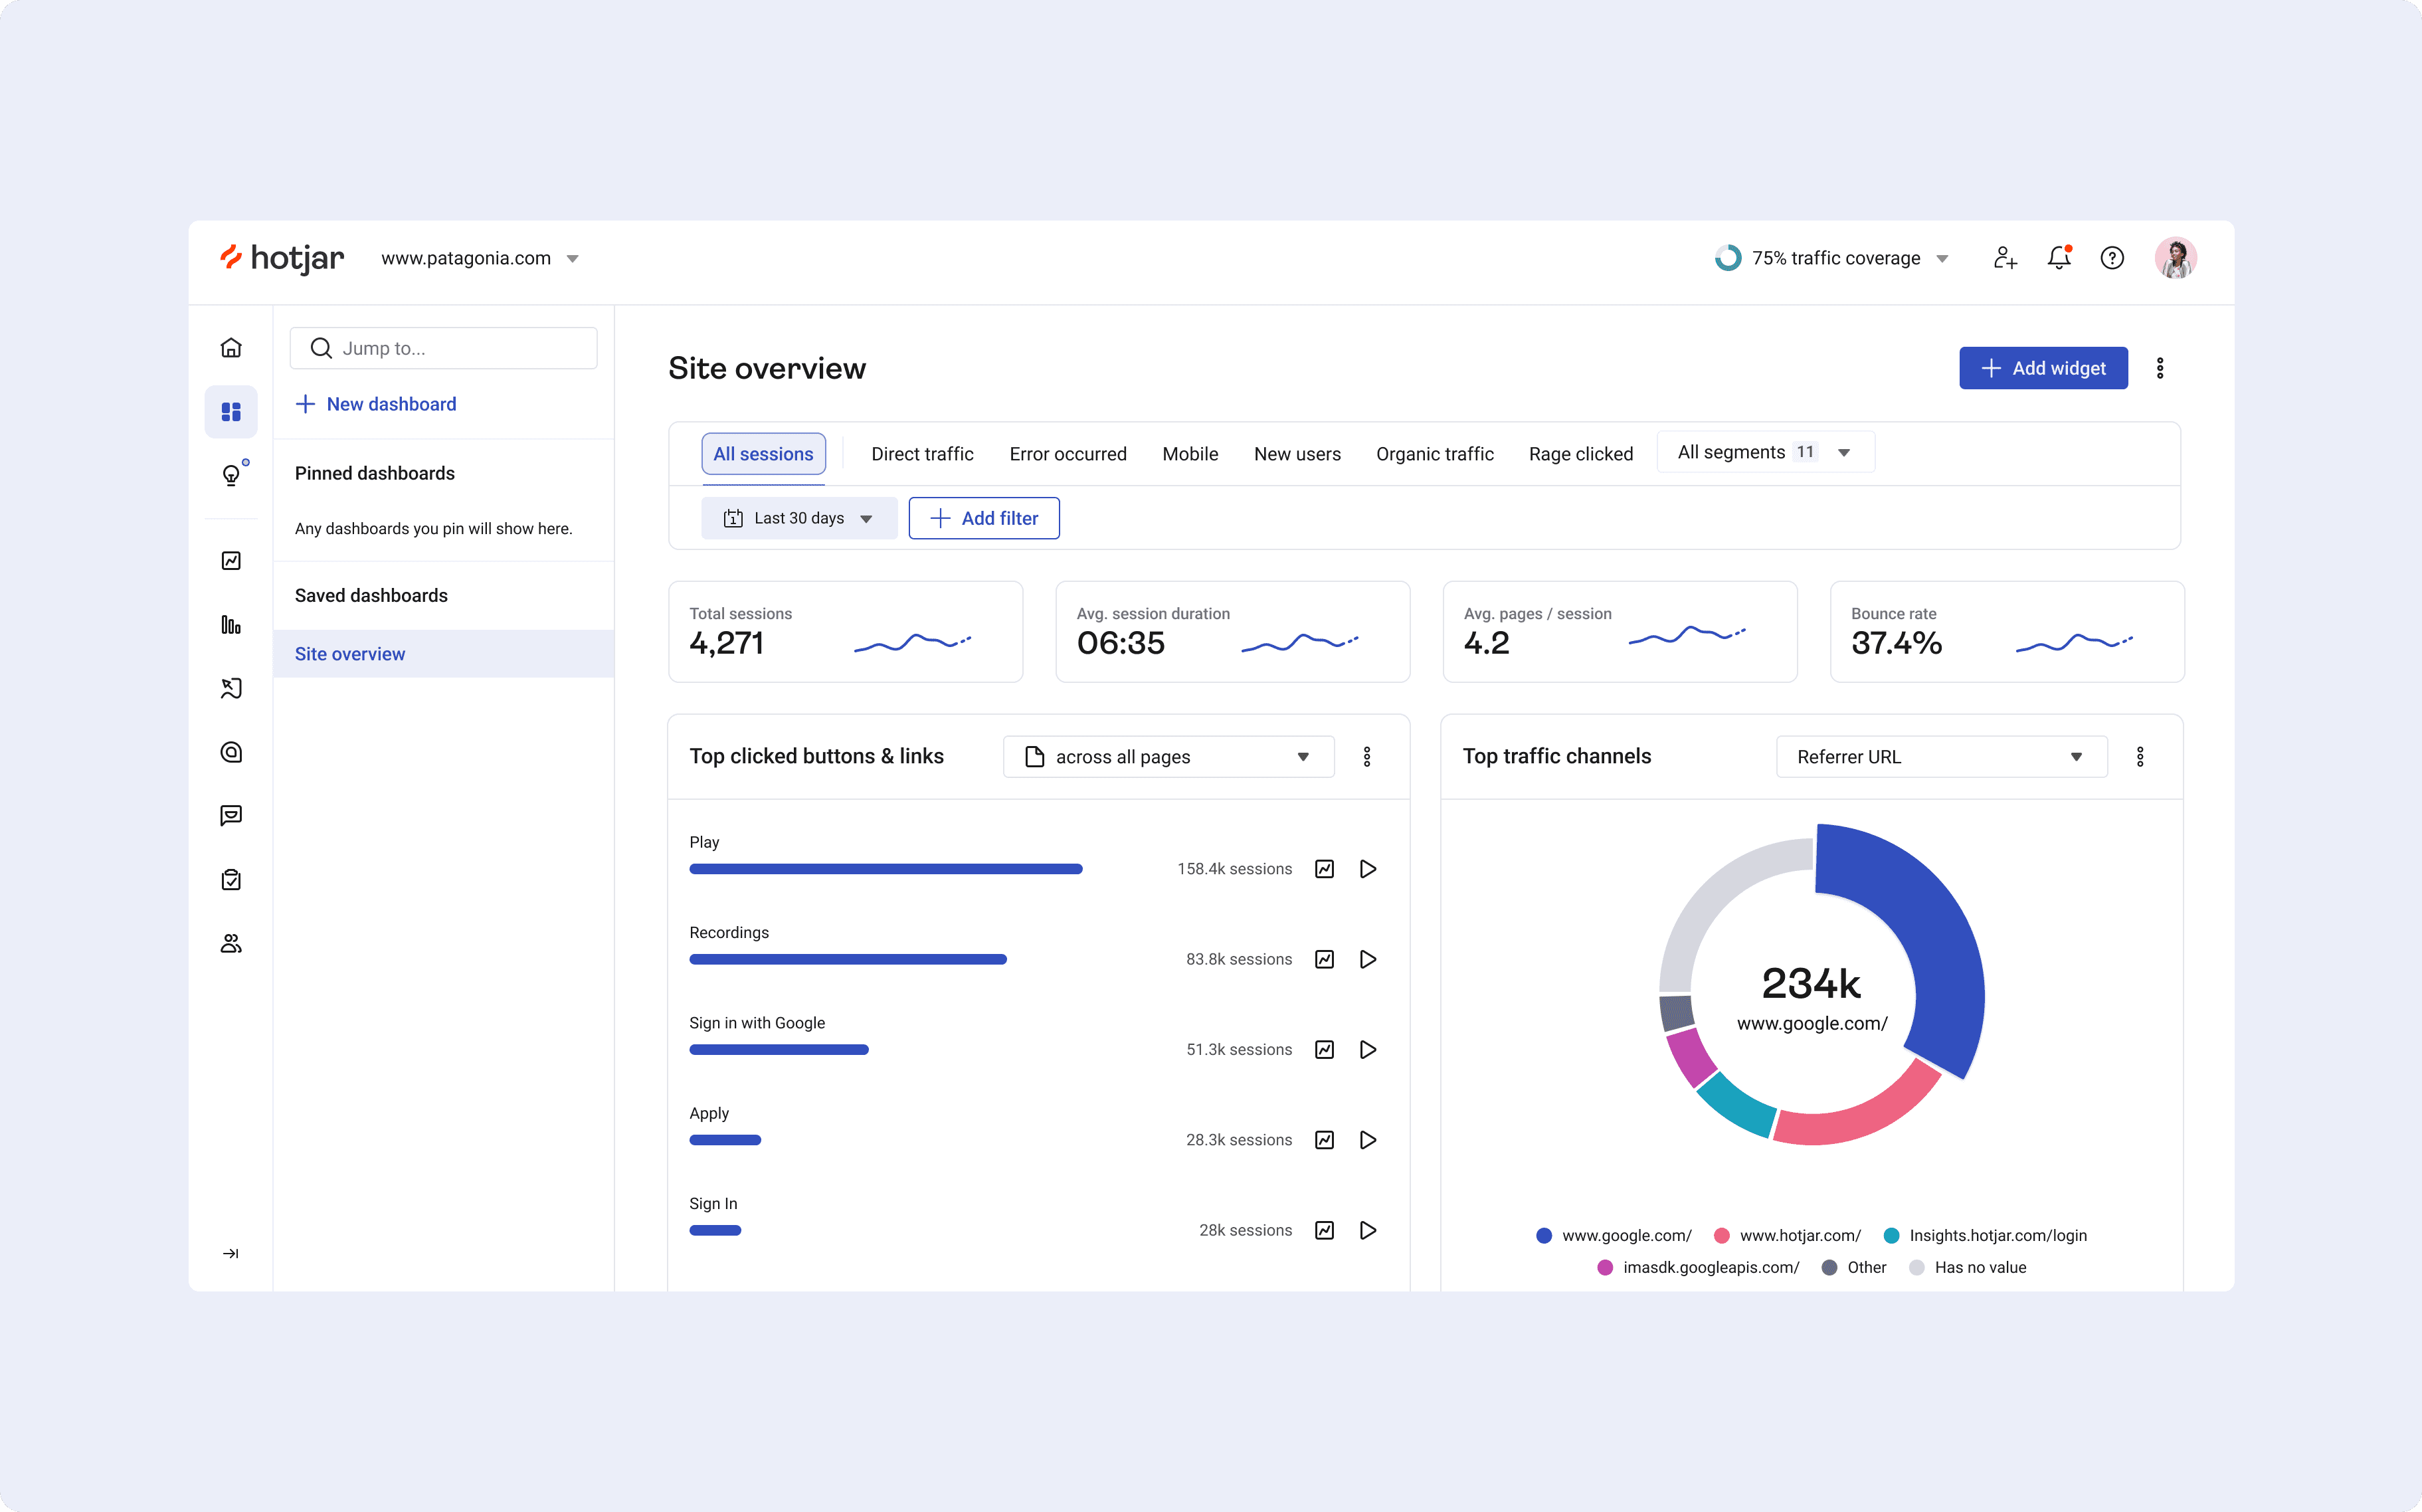
The first draft of the dashboard, including interactions such as the interchangeable chart types (pie, line or bar chart), changing the calculation (percentage or count), loading and hover states.

Continuous feedback
How it worked:
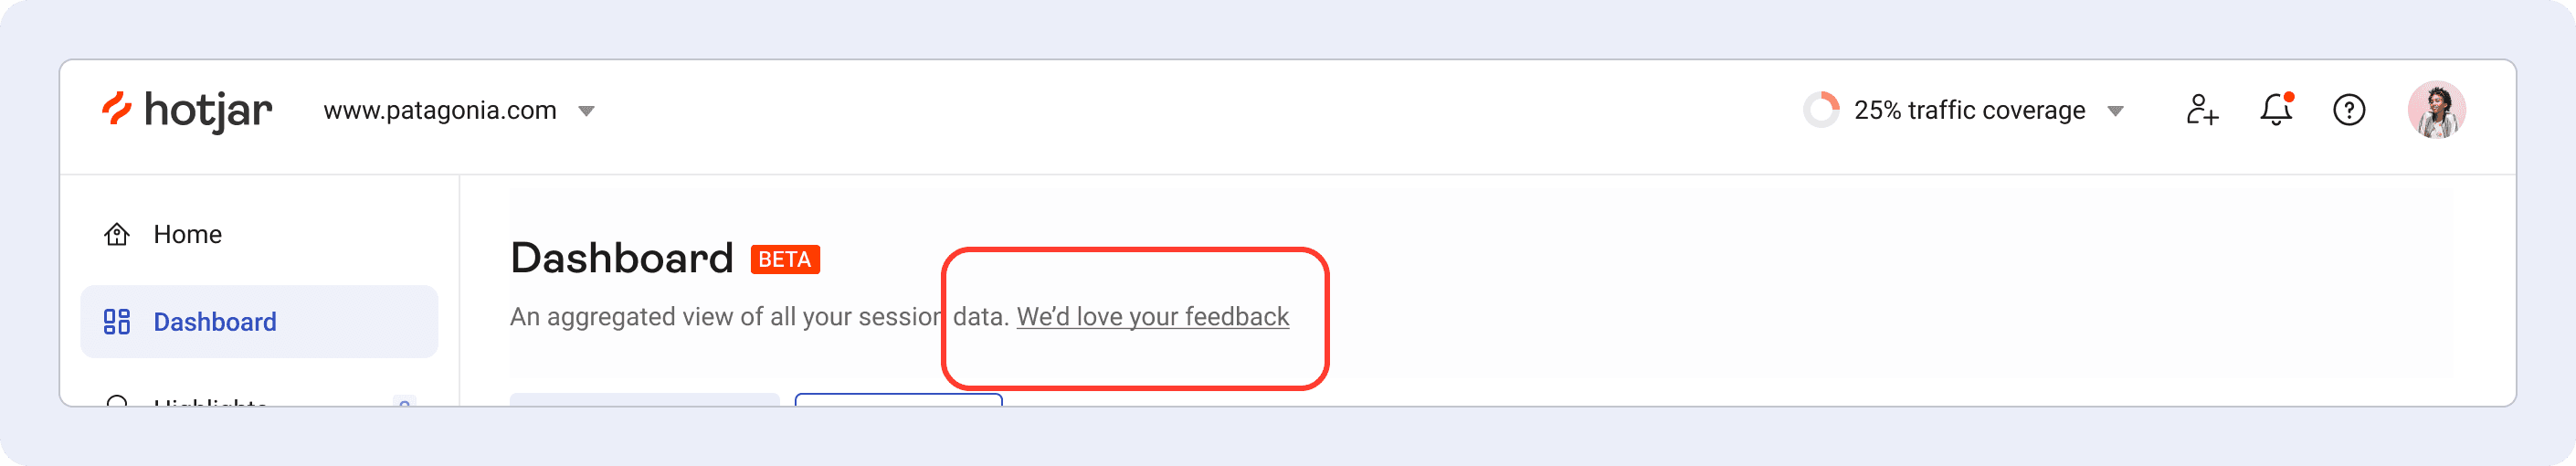
Added a feedback link to the top of the Dashboard (later added to other tools).
The link opened an external survey (created with Hotjar).
Among the questions were UMUX lite questions (meets my needs and is easy to use), as well as questions about analytics use and struggles.
In the end, users were optionally invited to schedule a user interview using Calendly (we blocked out two days per week, morning or afternoon for US users in our calendars) if they wished to share more feedback.
Survey results were forwarded to a dedicated Slack channel, where anyone could keep track of incoming feedback on a daily basis.
As a result, 1-3 interviews were scheduled per week for the following six months.
Interviews were divided into two:
Interview questions and user sharing screen to identify usability issues and areas for improvement when using Hotjar general and analytics tools.
Prototype testing – Get early feedback on new concepts and iterations of the dashboard, such as custom dashboards.
*Every 5-6 interviews, we changed the prototype with adjusted changes, new features or tools.
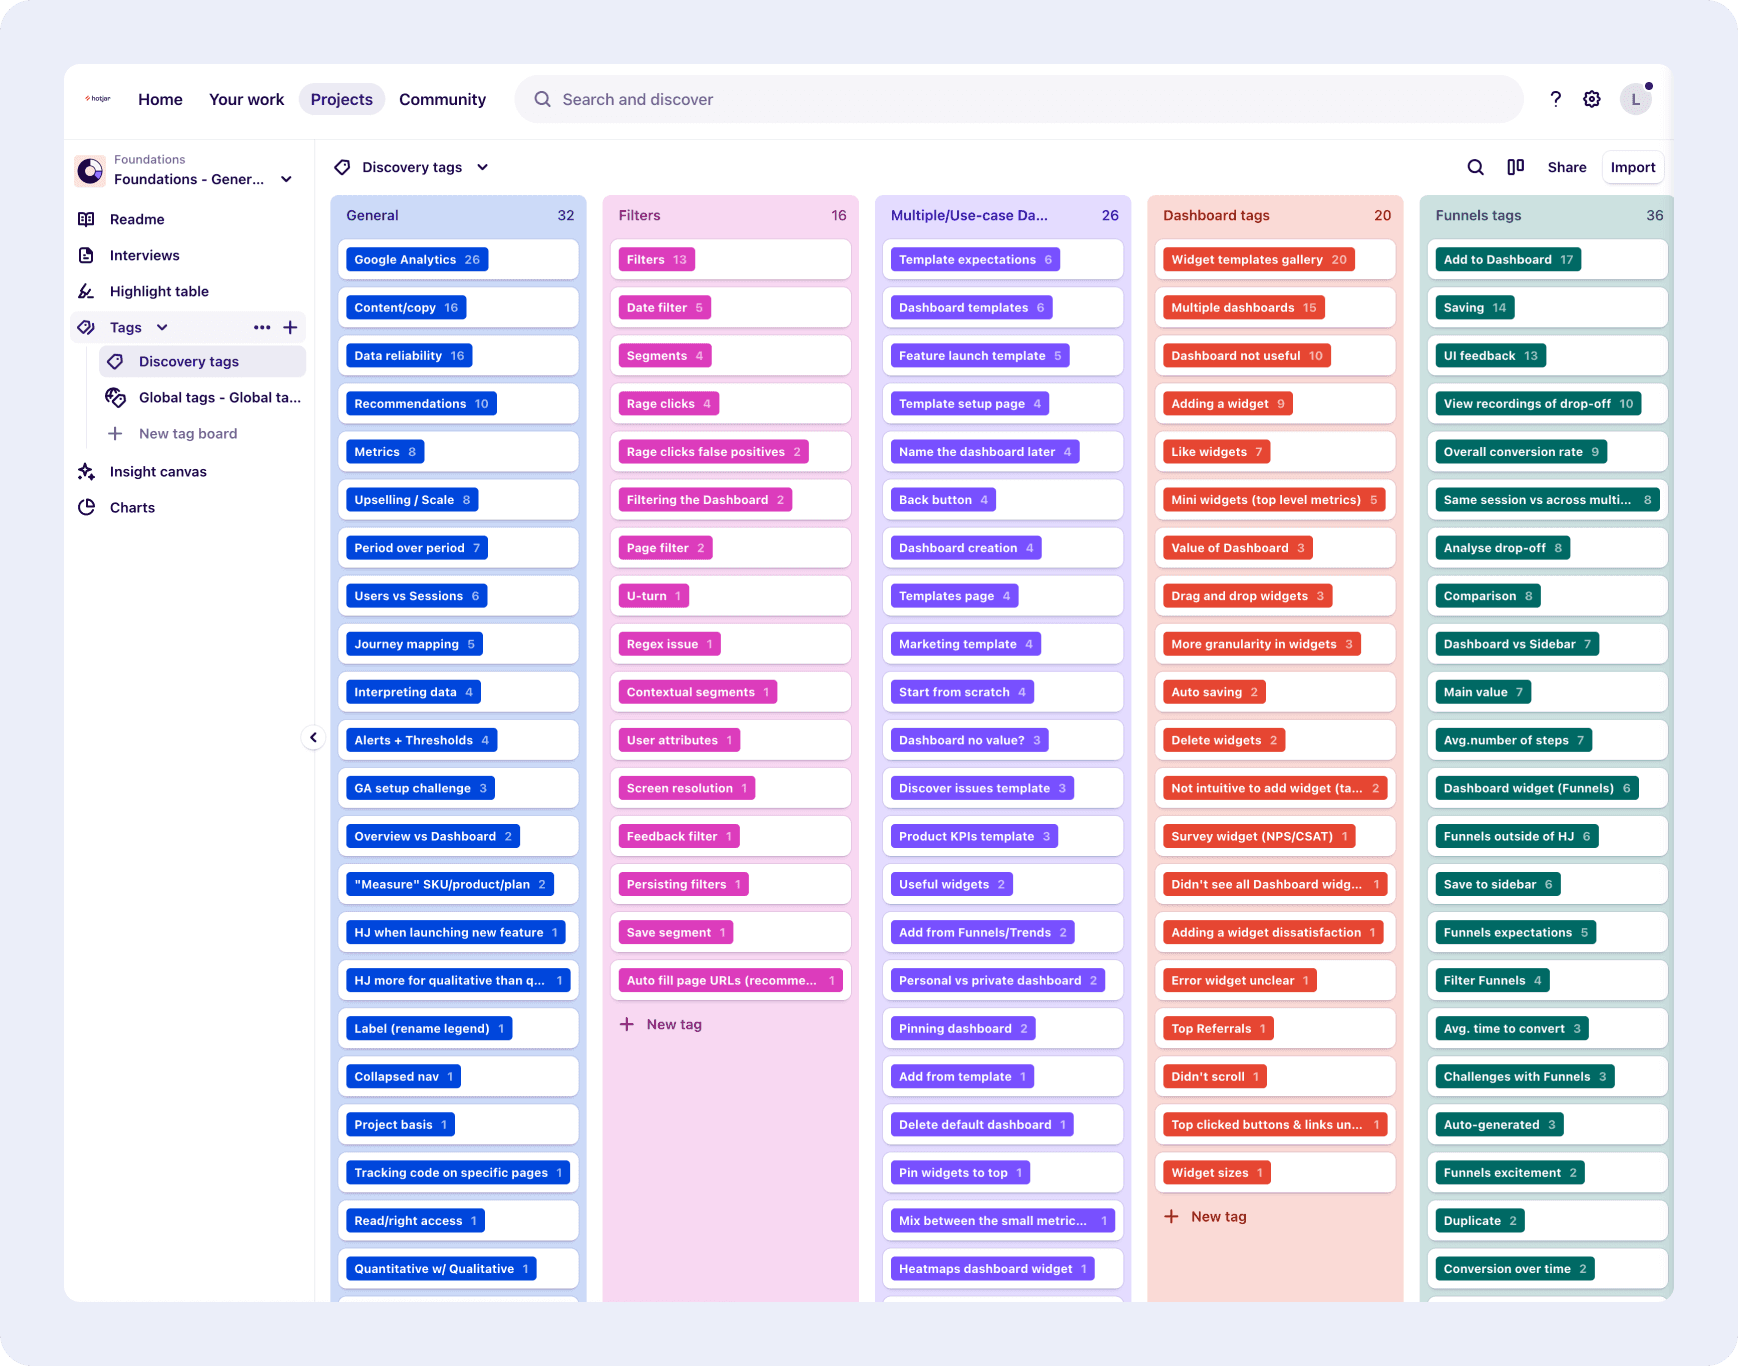
Research Repository
After each interview, we used Dovetail as the research repository to import the interviews, transcribe, extra user quotes, generate clips (to share with the team on Slack and add to research reports) and tag key insights that would then be used to prioritize future features.
Survey Results
Survey results were analyzed and summarized every month or quarter, depending on the amount of responses.

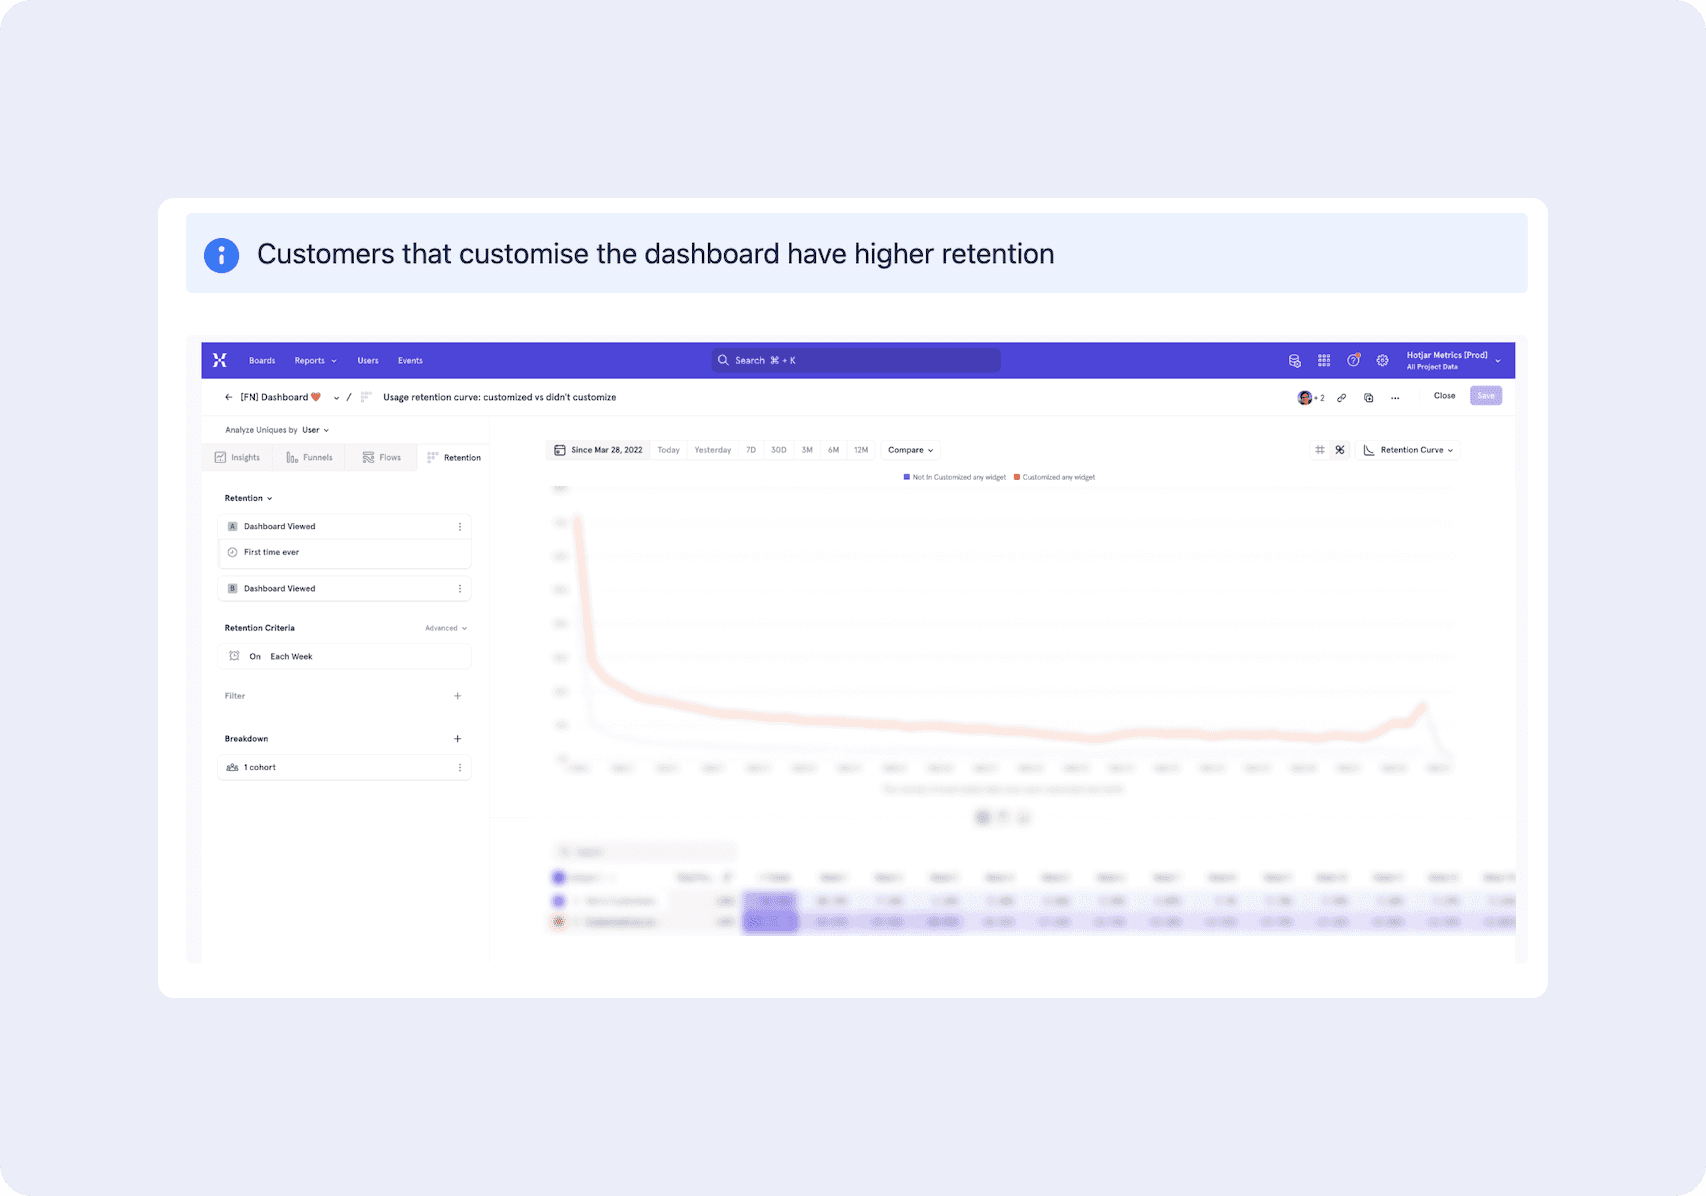
Mixpanel Data
Incorporate quantitative data from Mixpanel to support insights gained from user interviews and surveys.

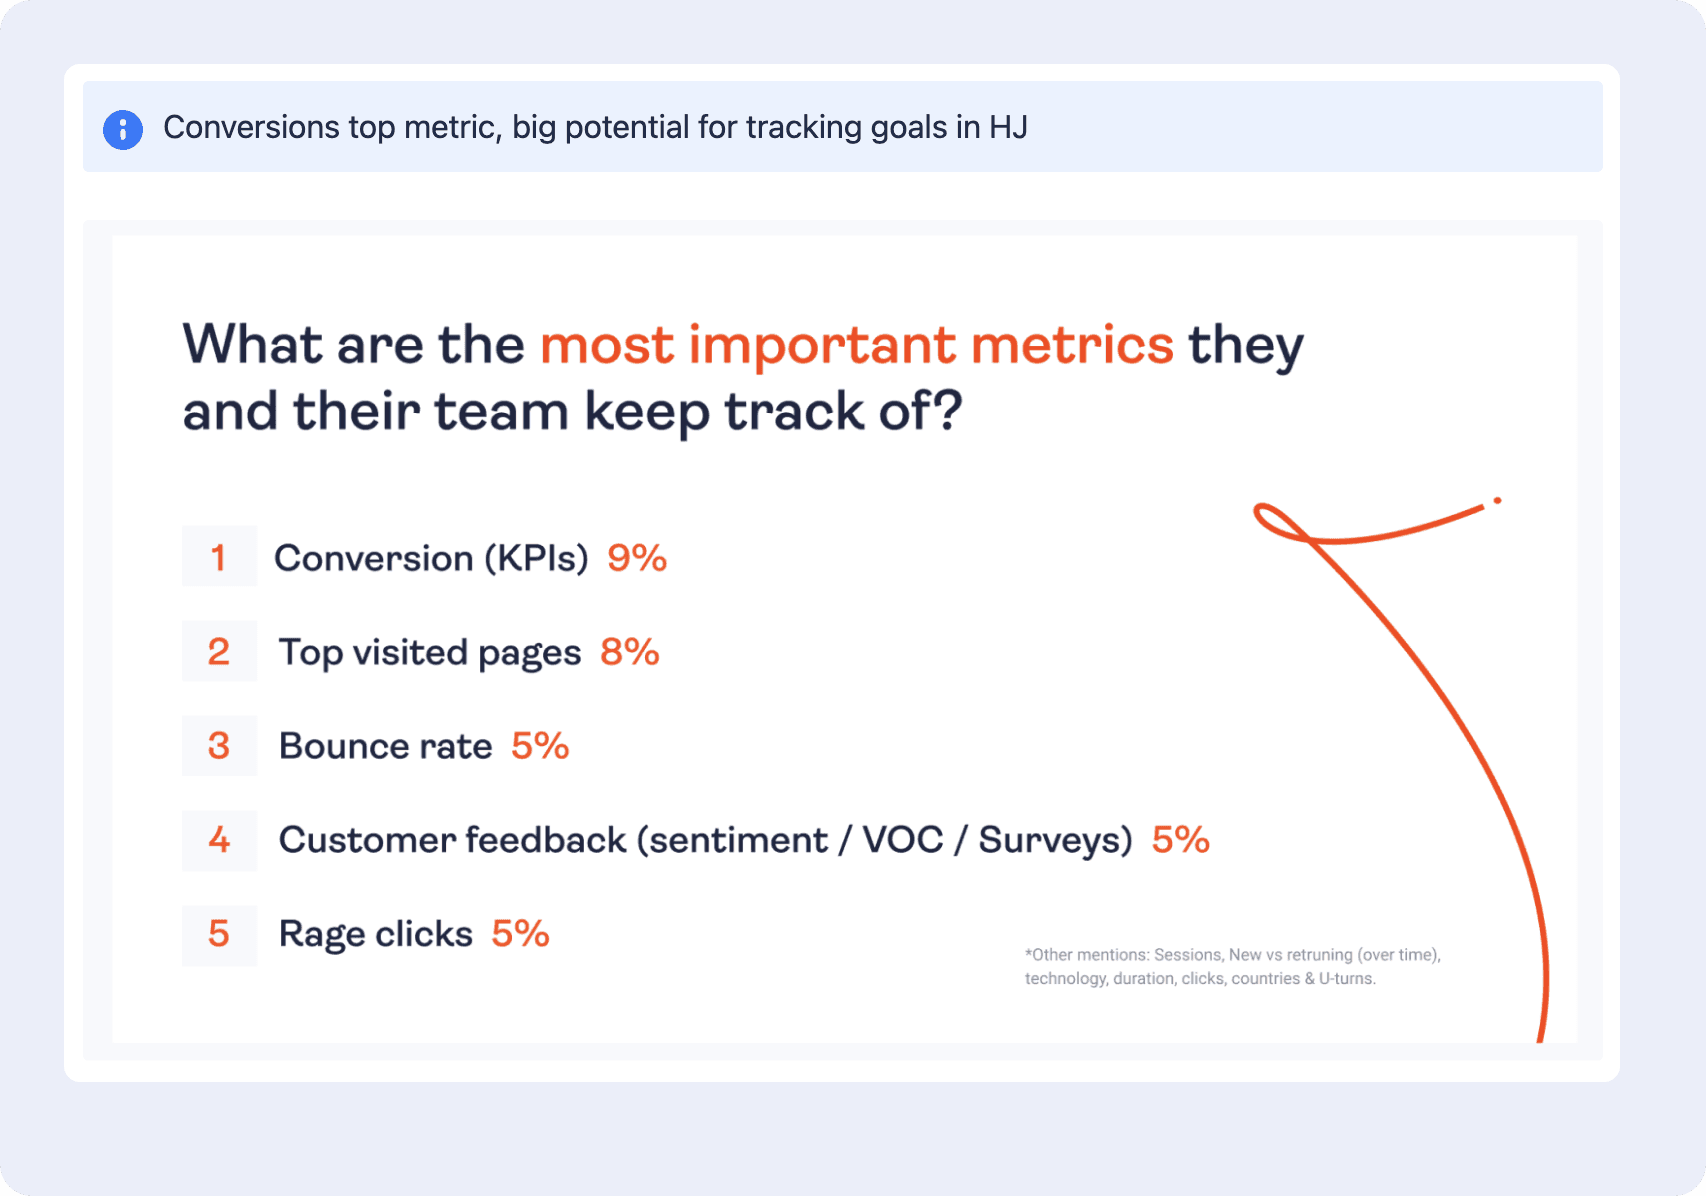
Opportunity Mapping
The research findings and tags in the research repository enabled us to spot opportunities, i.e. the topics that had been mentioned most. This helped us prioritize and build business cases to strategically plan key initiatives.

Version Story Mapping
*Trio - Product Manager, Engineering Lead and Product Designer (myself).
Working as the product trio, we establishing the next steps for the product launch, including determining the order in which features will be implemented.
To visually breakdown the product launches, I developed a version story map so that the engineering team could clearly see which features are part of each launch. In addition, it aligned better with marketing, so that they would be able to plan material with visuals in advance and know when specific features would be released.
Minimum Testable Product (MTP):
Beta Launch – Non customizable dashboard (users can only change calculations and chart visuals)
Minimum Viable Product (MVP):
Ability to filter to make the data more relevant
Minimum Usable Product (MUP):
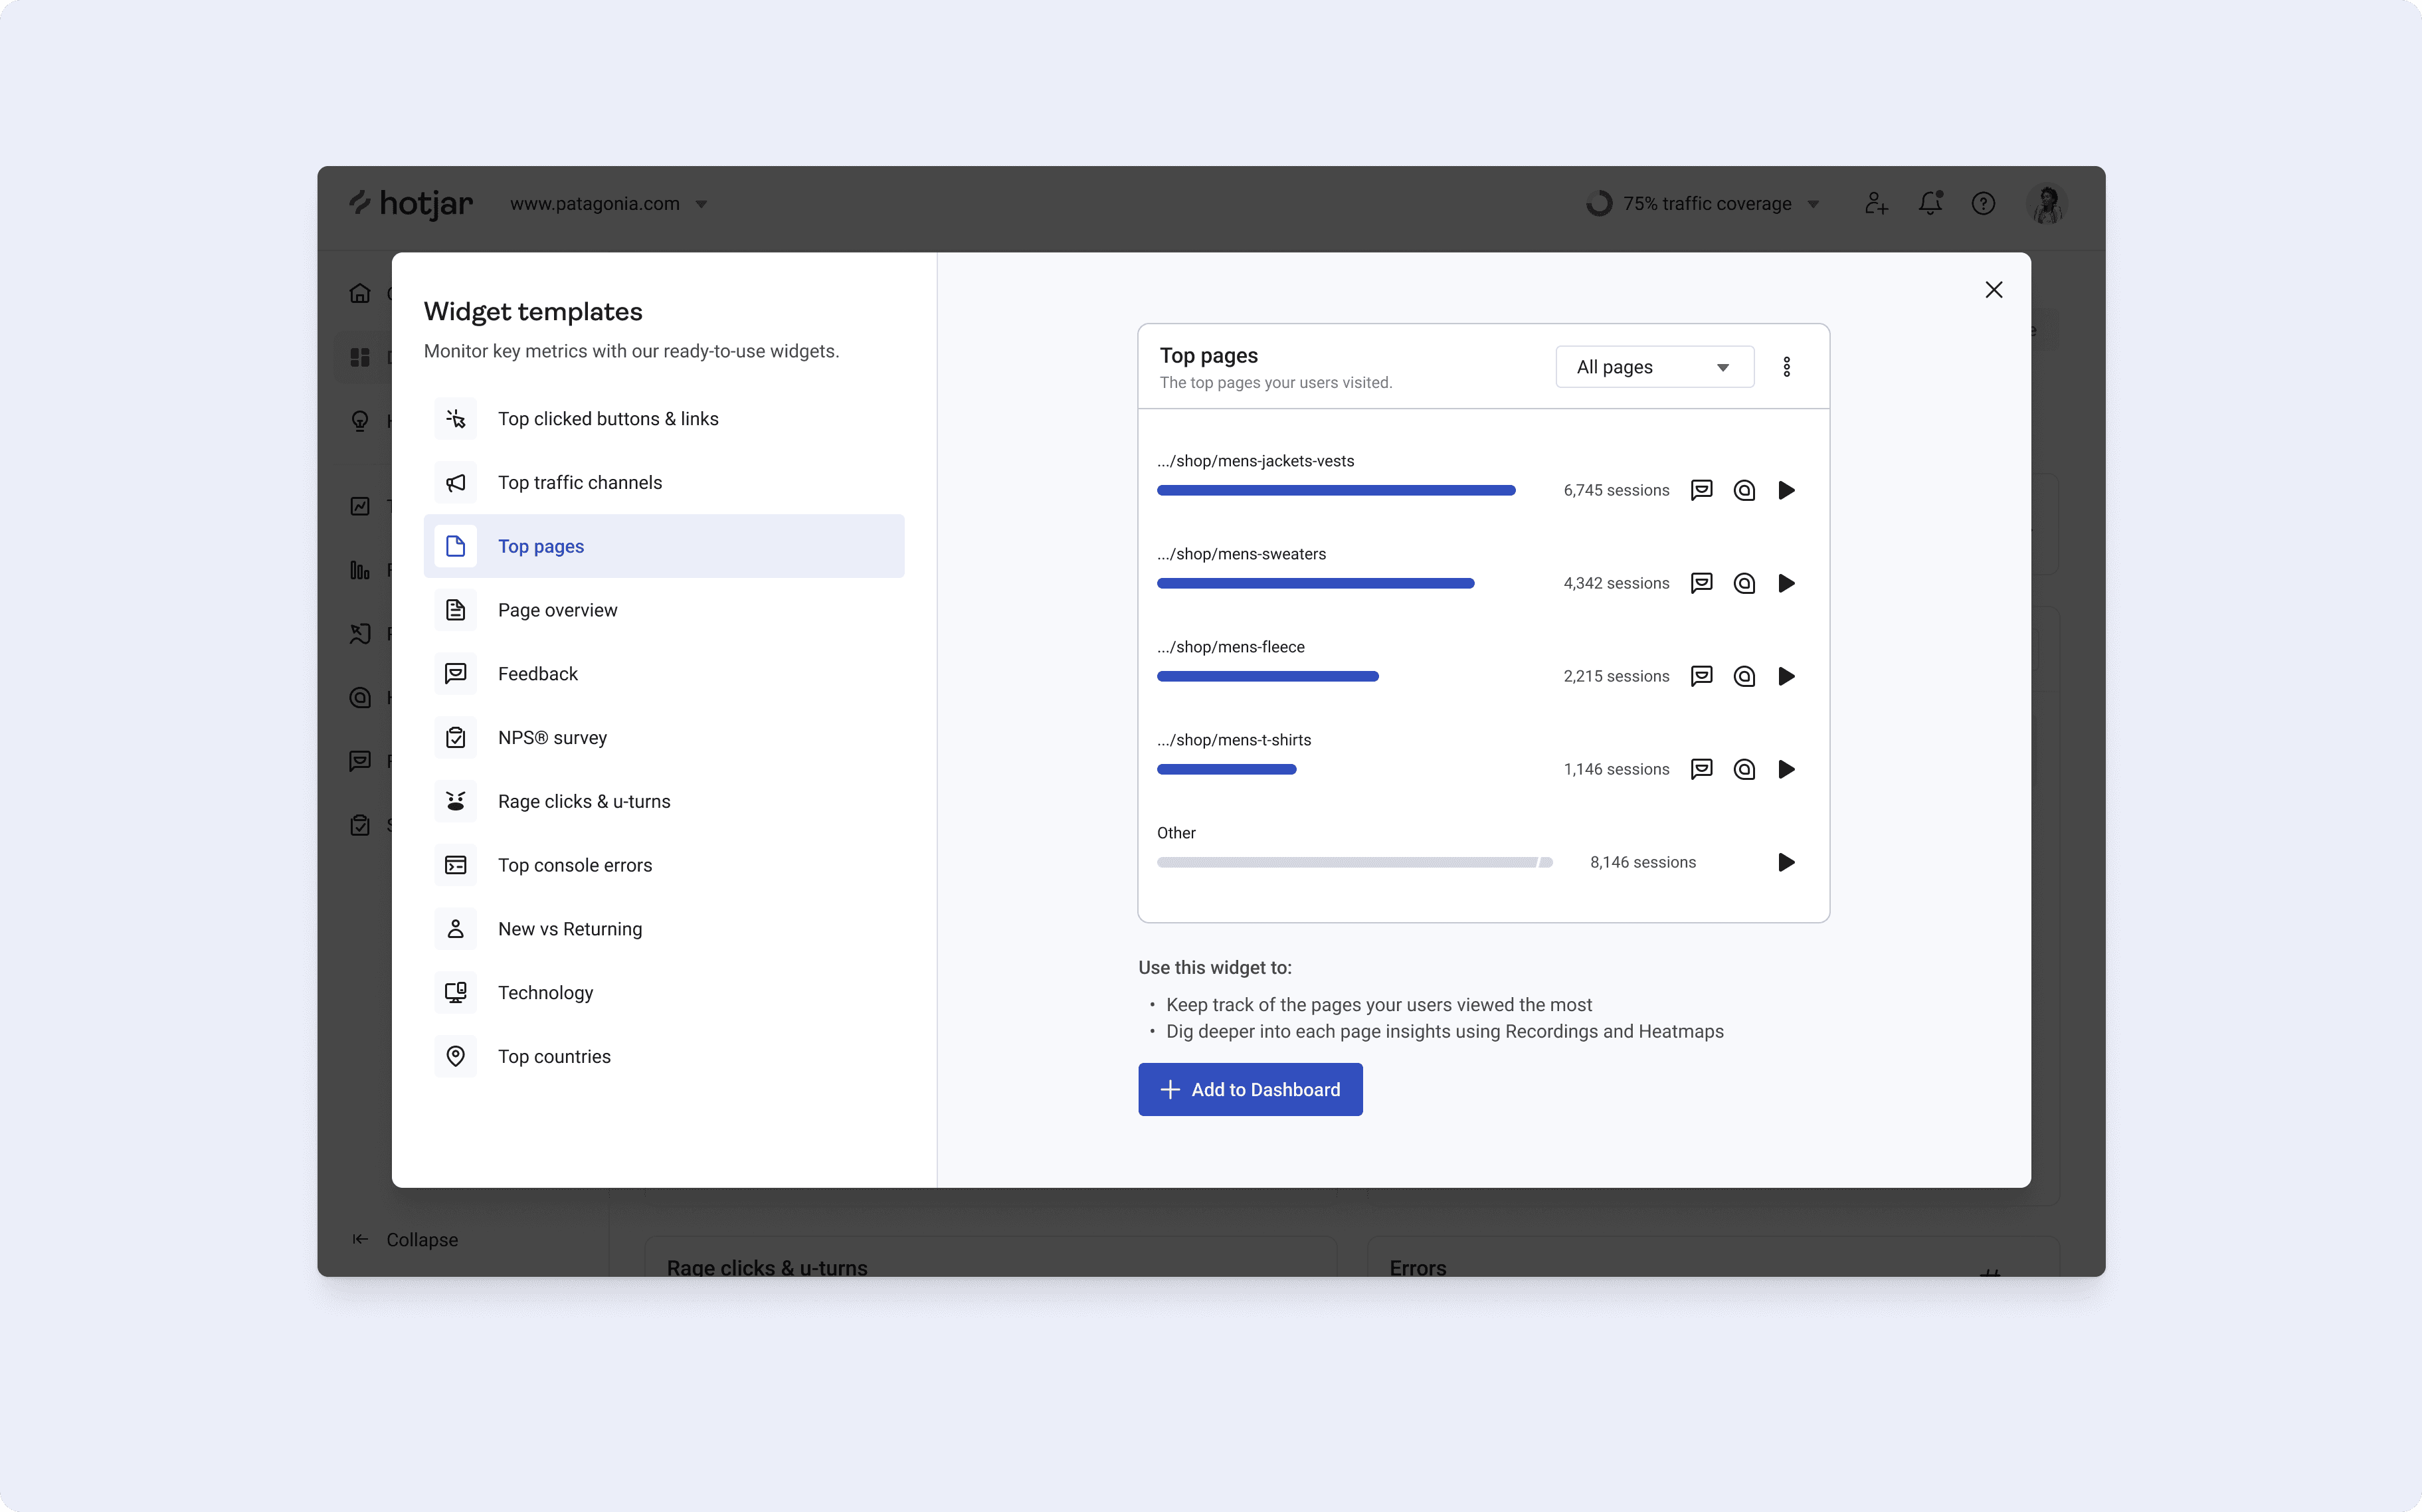
Ability to delete and add widgets through a template gallery
Delete Widgets
Rename widgets
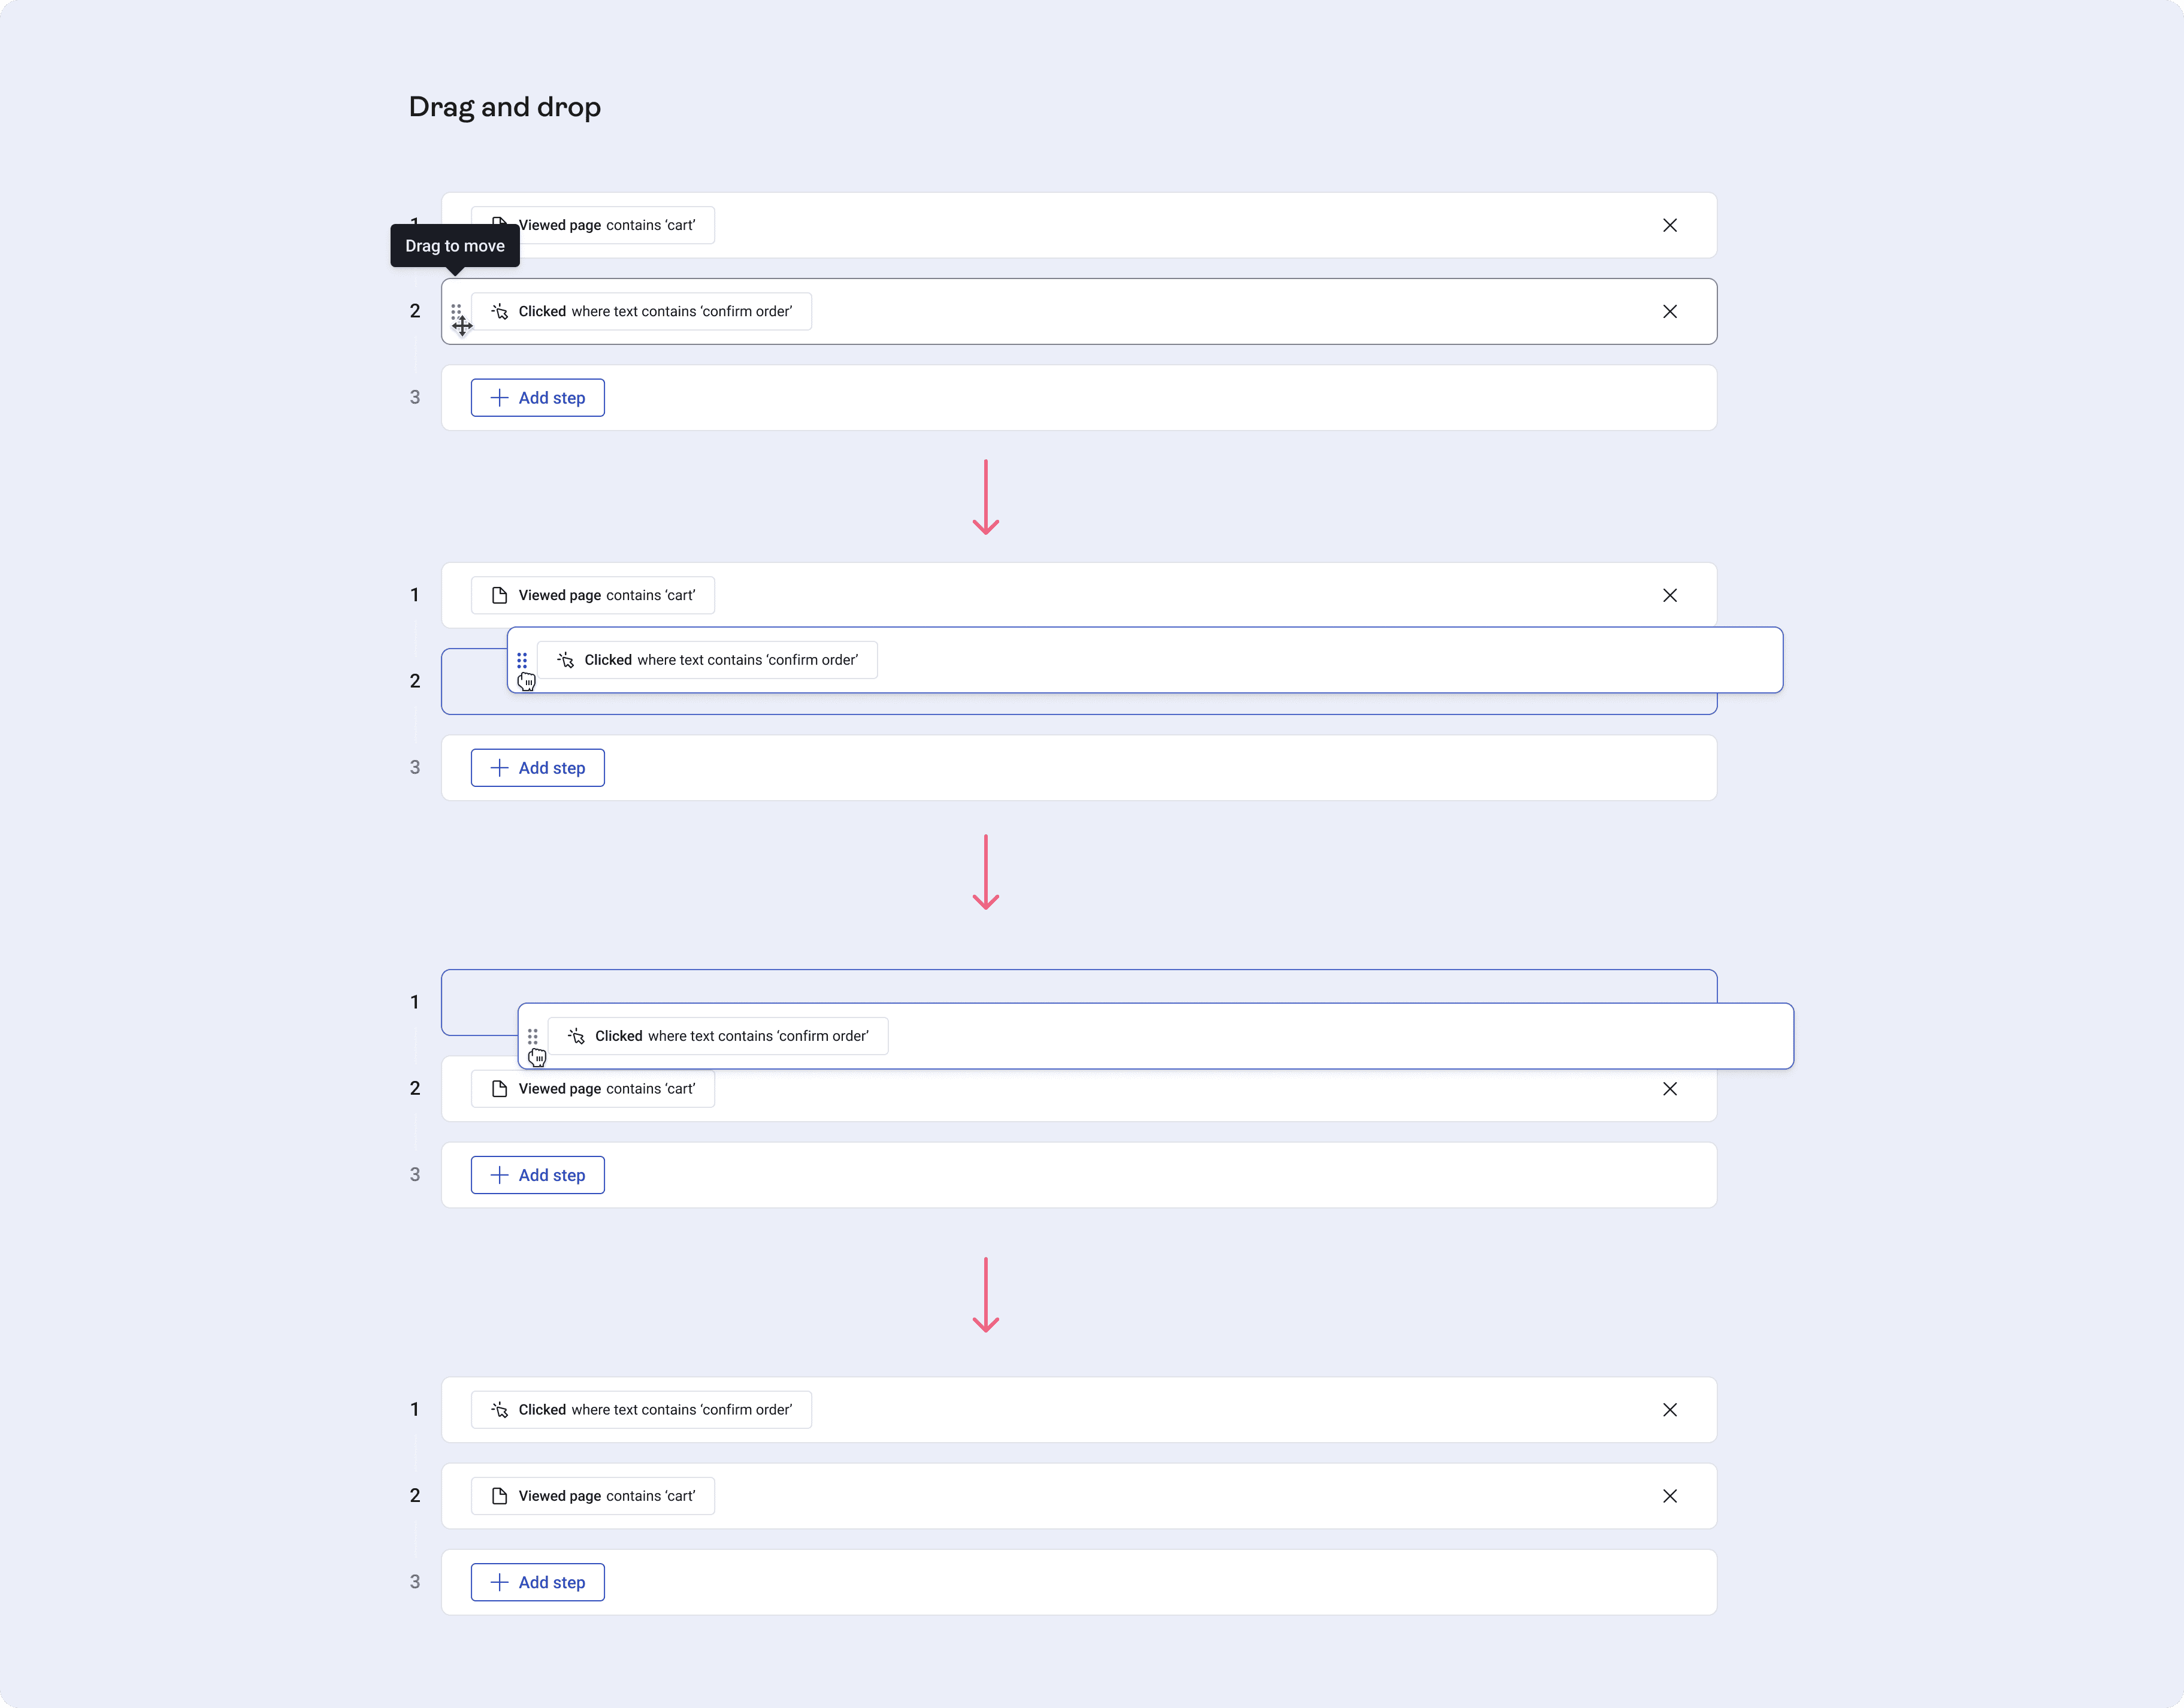
Drag & drop widgets
Save changes/ auto save?
Ability to add custom metrics?

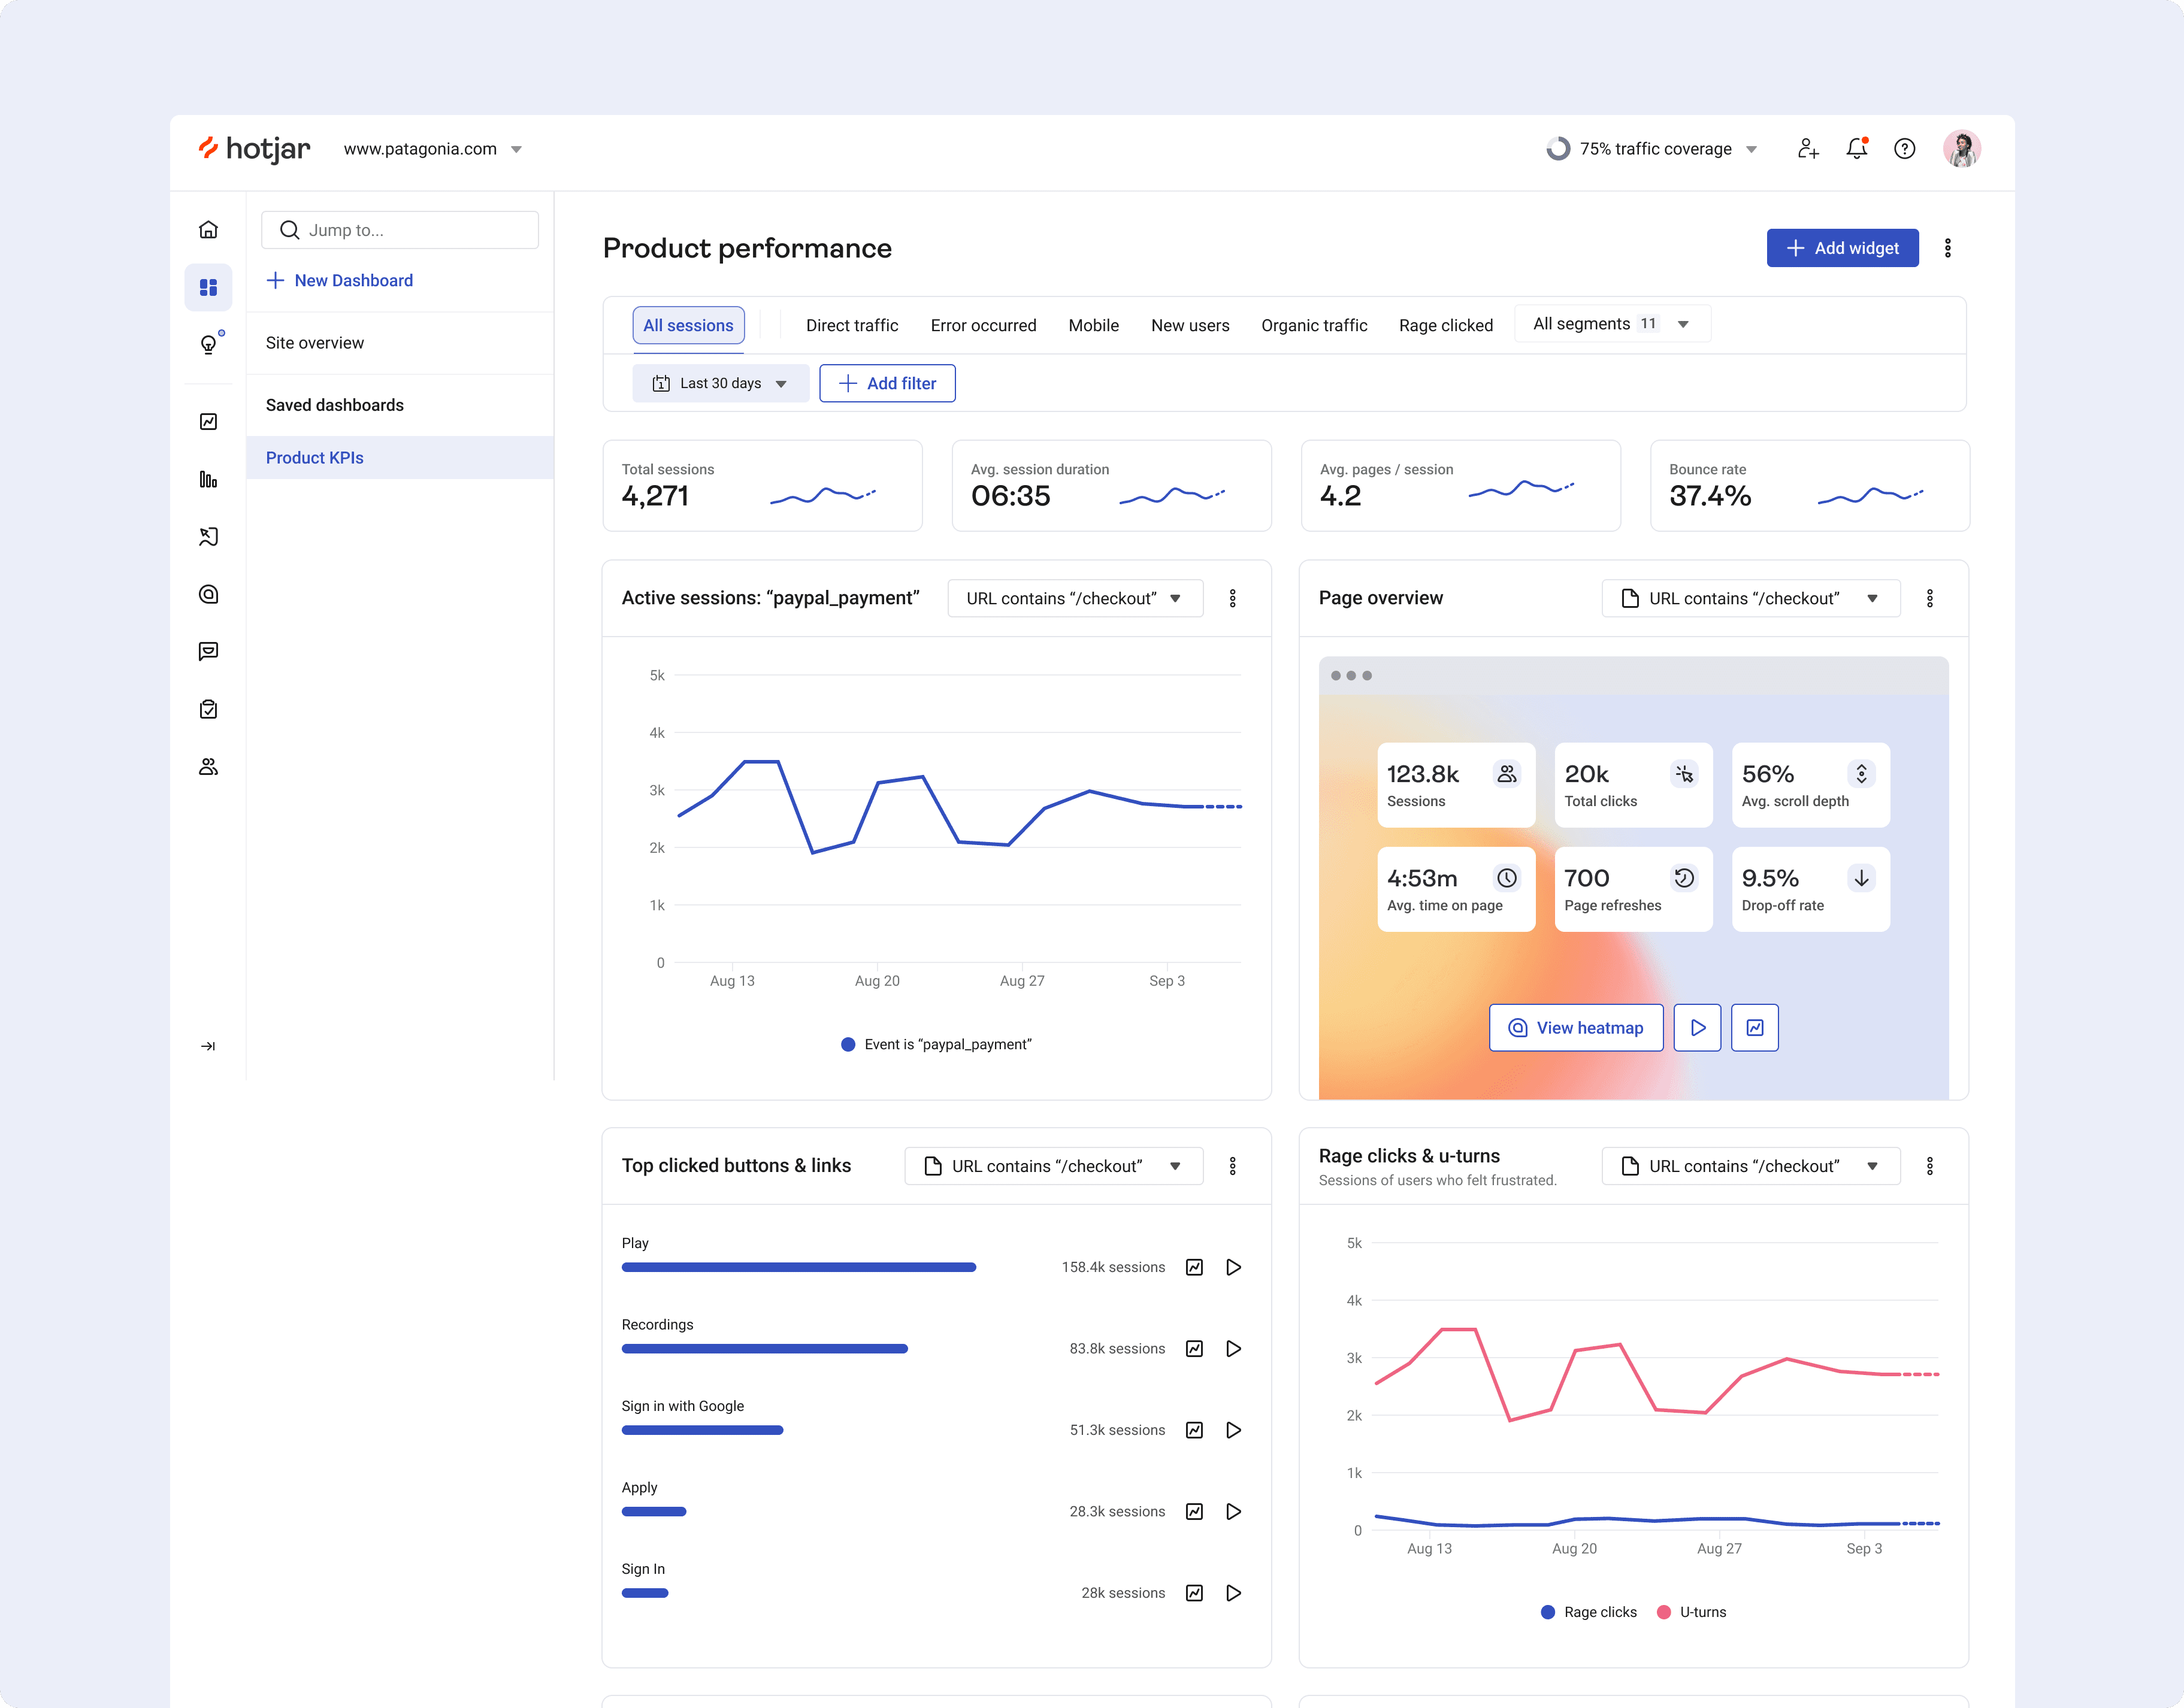
Custom Dashboards
Add widgets through a template gallery, delete Widgets, rename widgets, drag & drop widgets, and save changes.


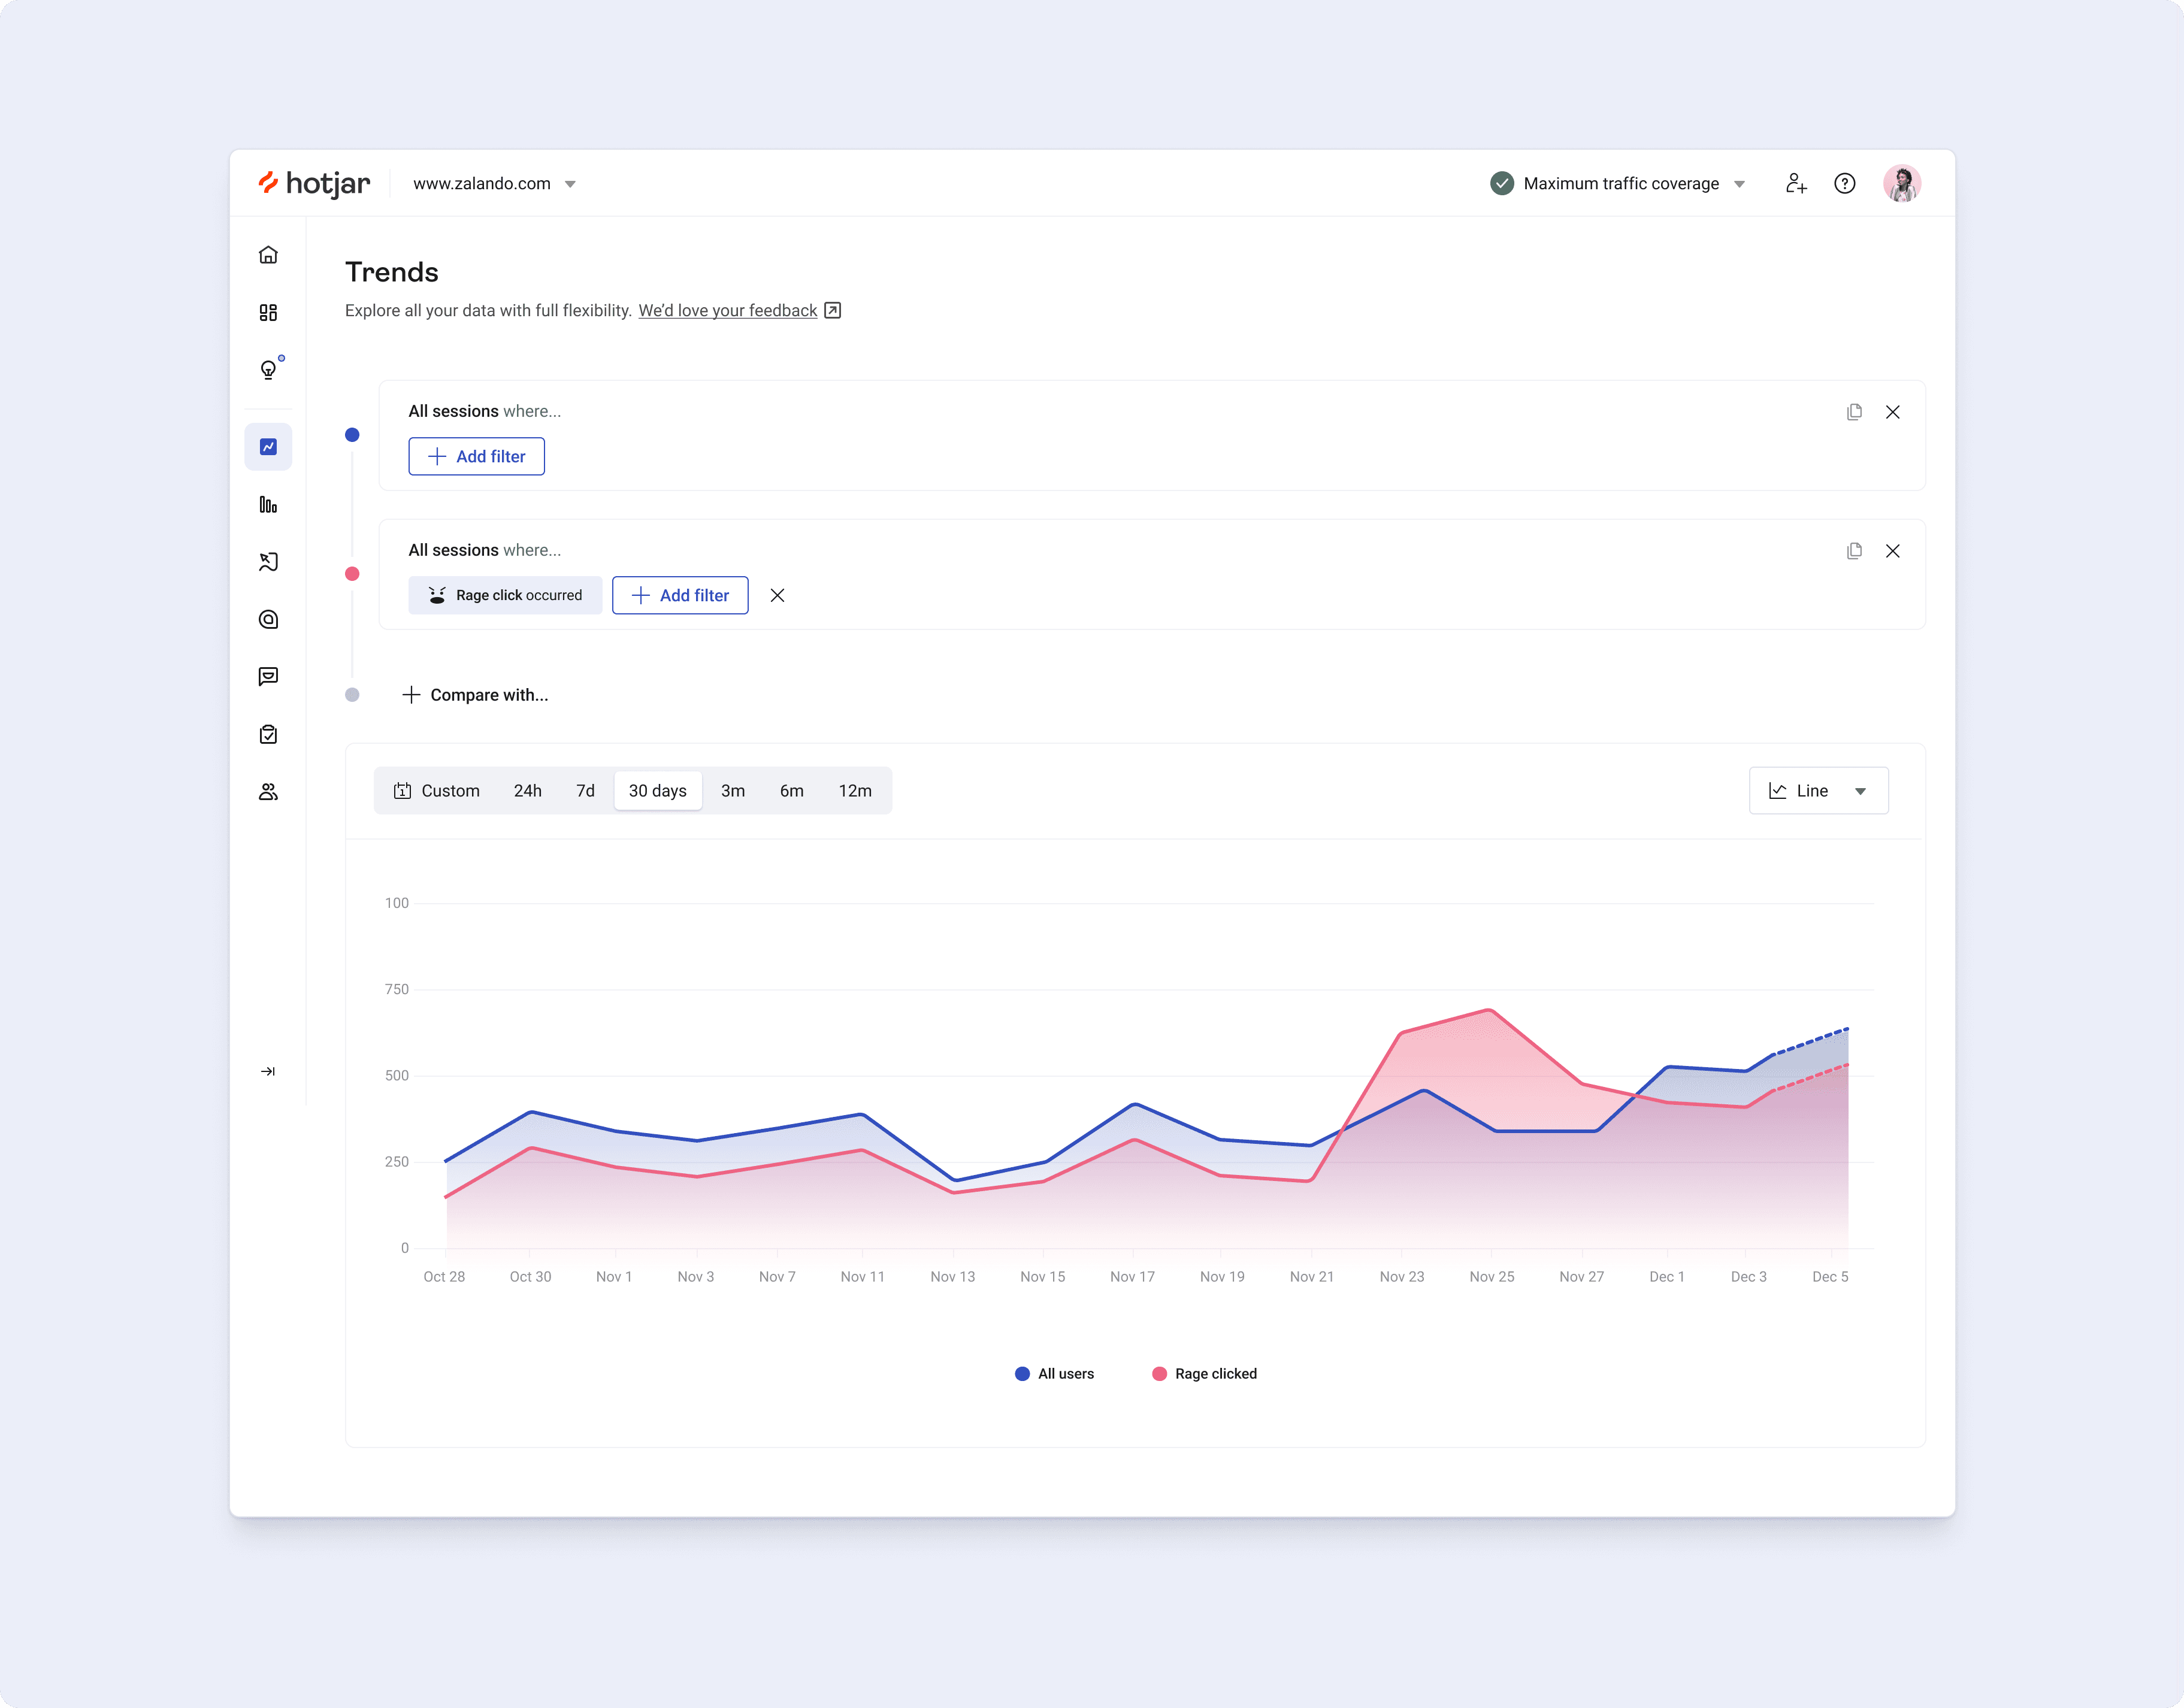
Trends - Track Custom Metrics
Visualize your most important metrics, spot user behavior trends, and uncover the why behind the numbers with deep links to the Recordings and Heatmaps.
With Trends, you can:
- Compare how different user segments convert on a single chart
- Discover user issues easily by plotting rage clicks and clicking through relevant recordings
- Track the results of your A/B test, and get more context with a single click
- Add custom metrics to your Dashboard
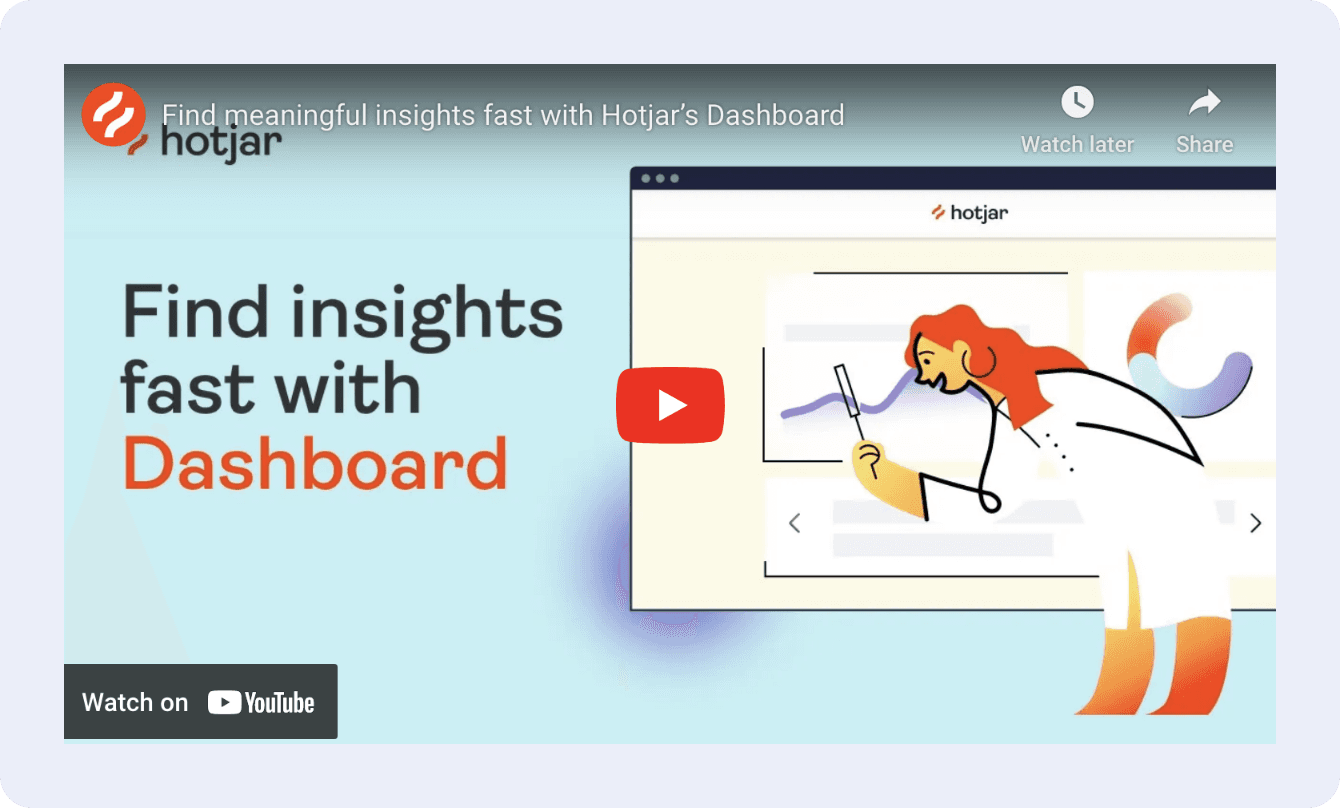
– Promo video

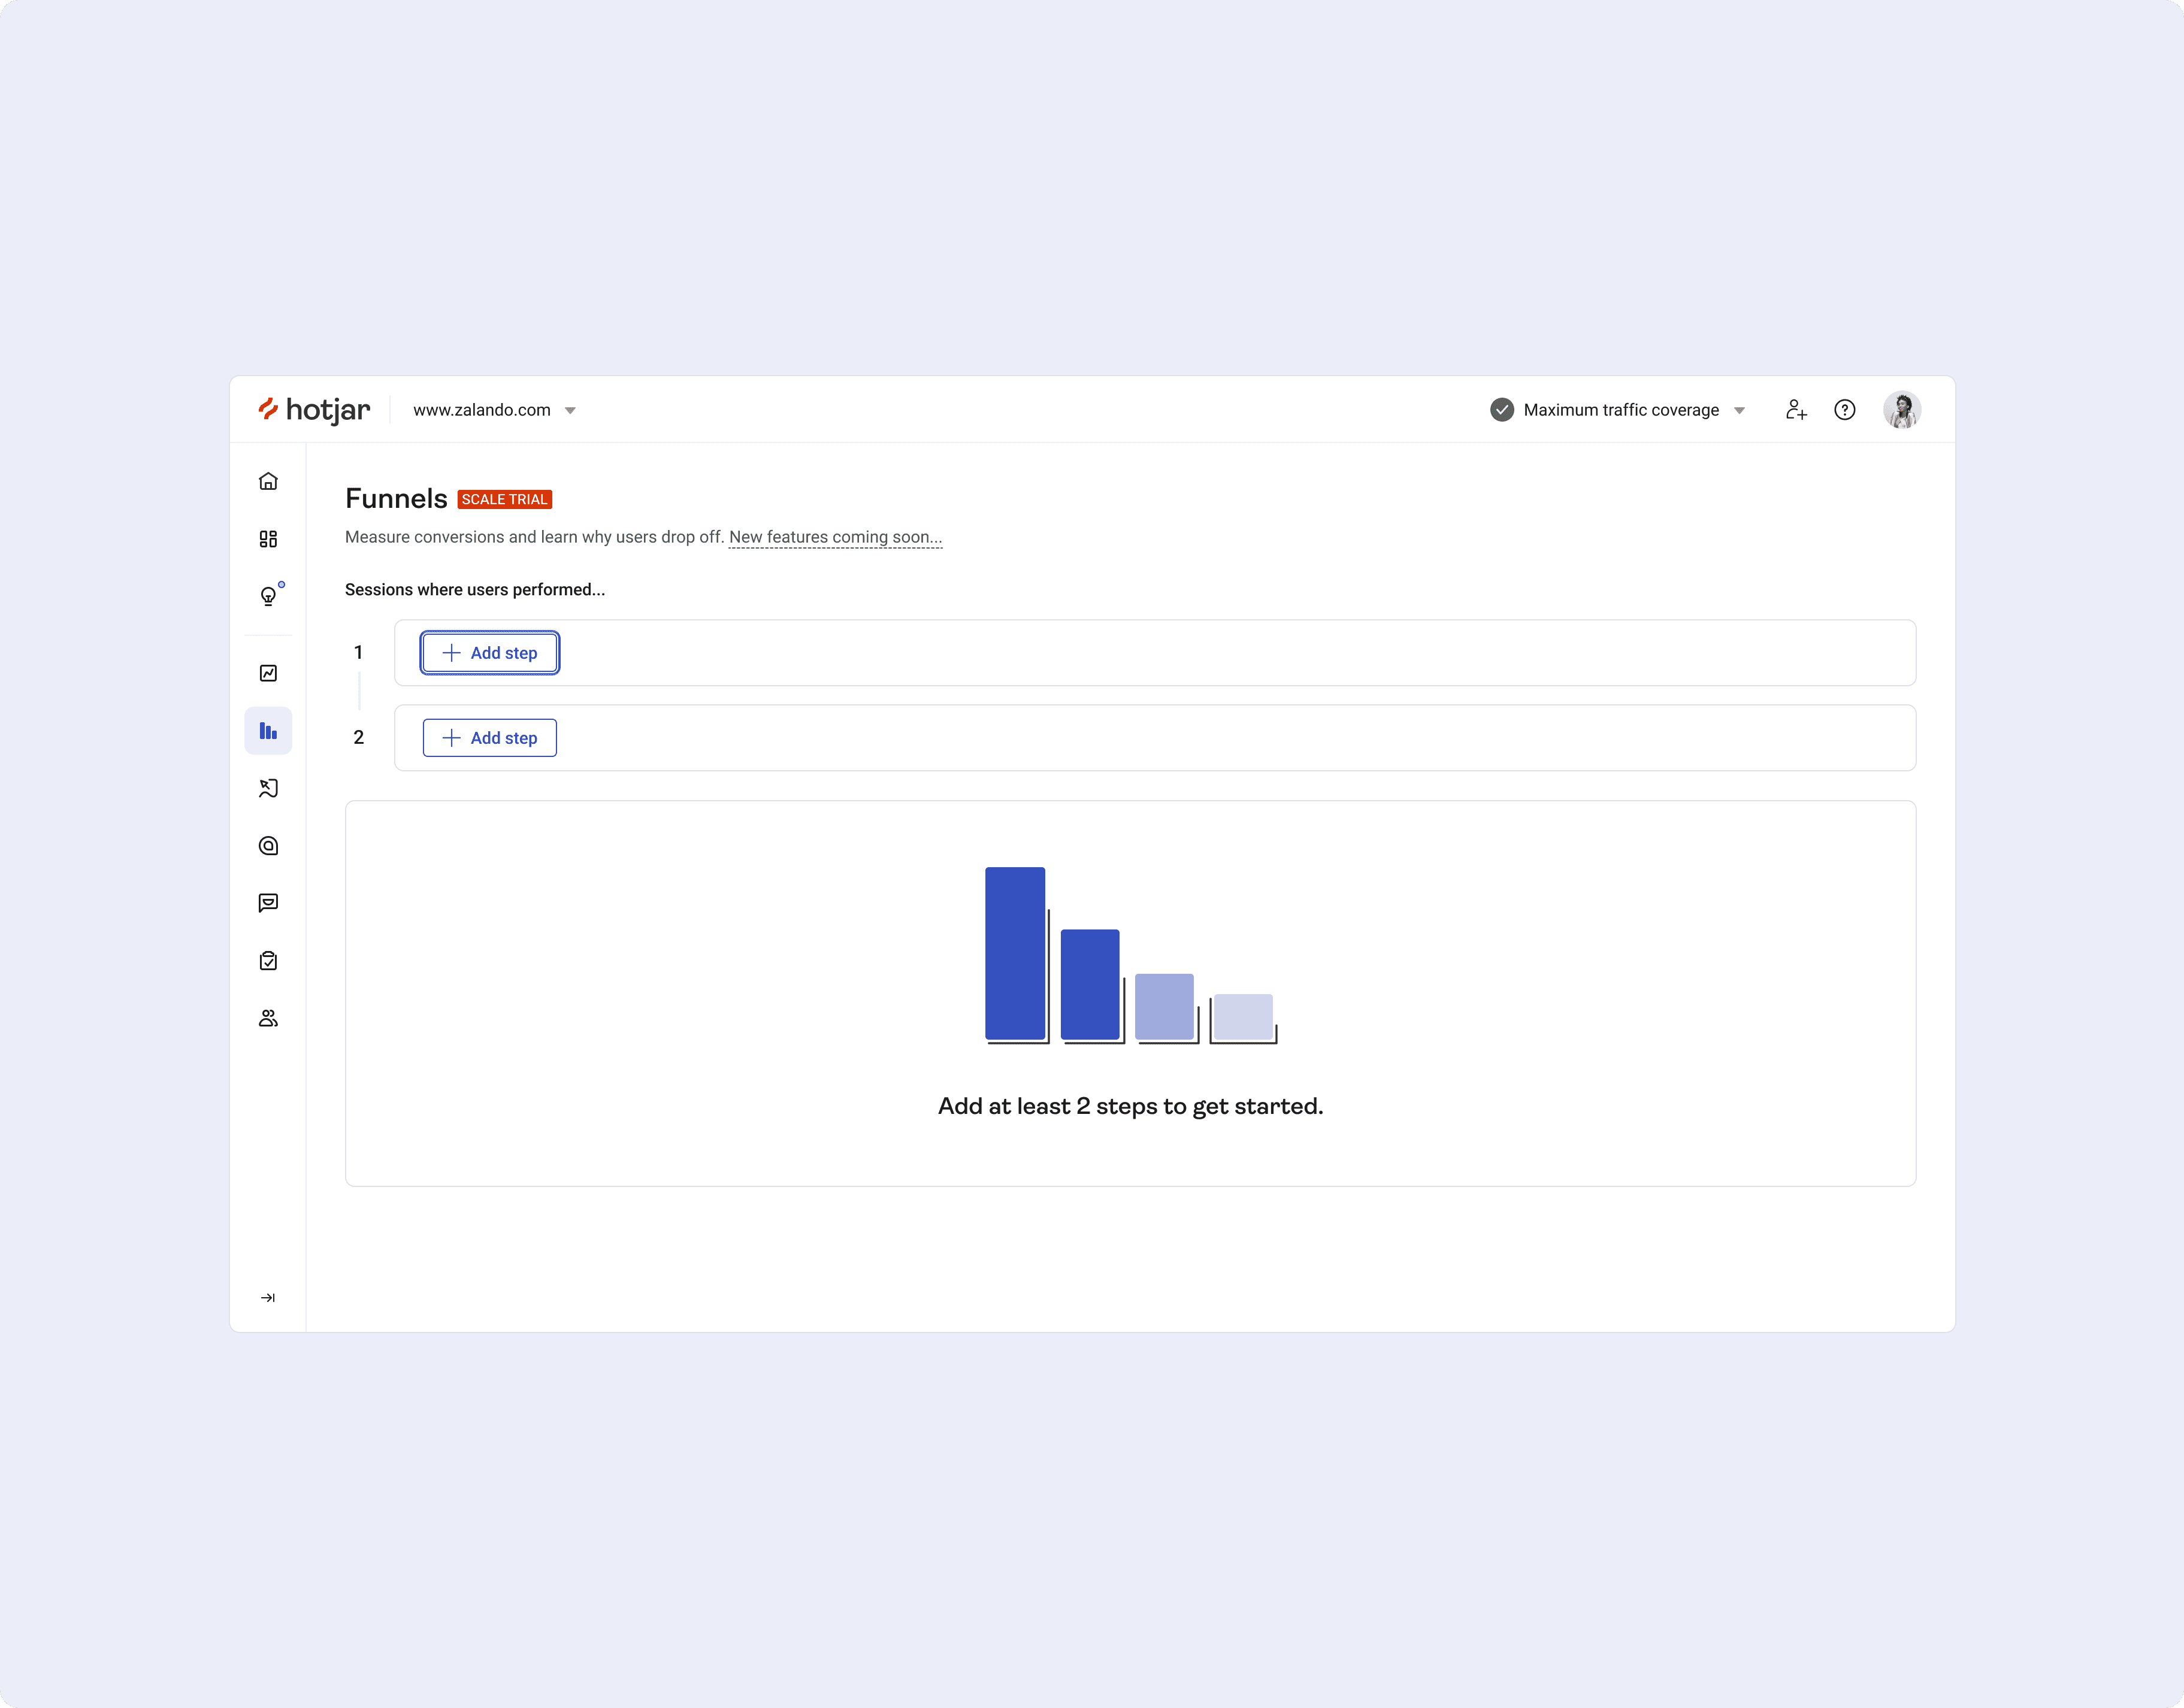
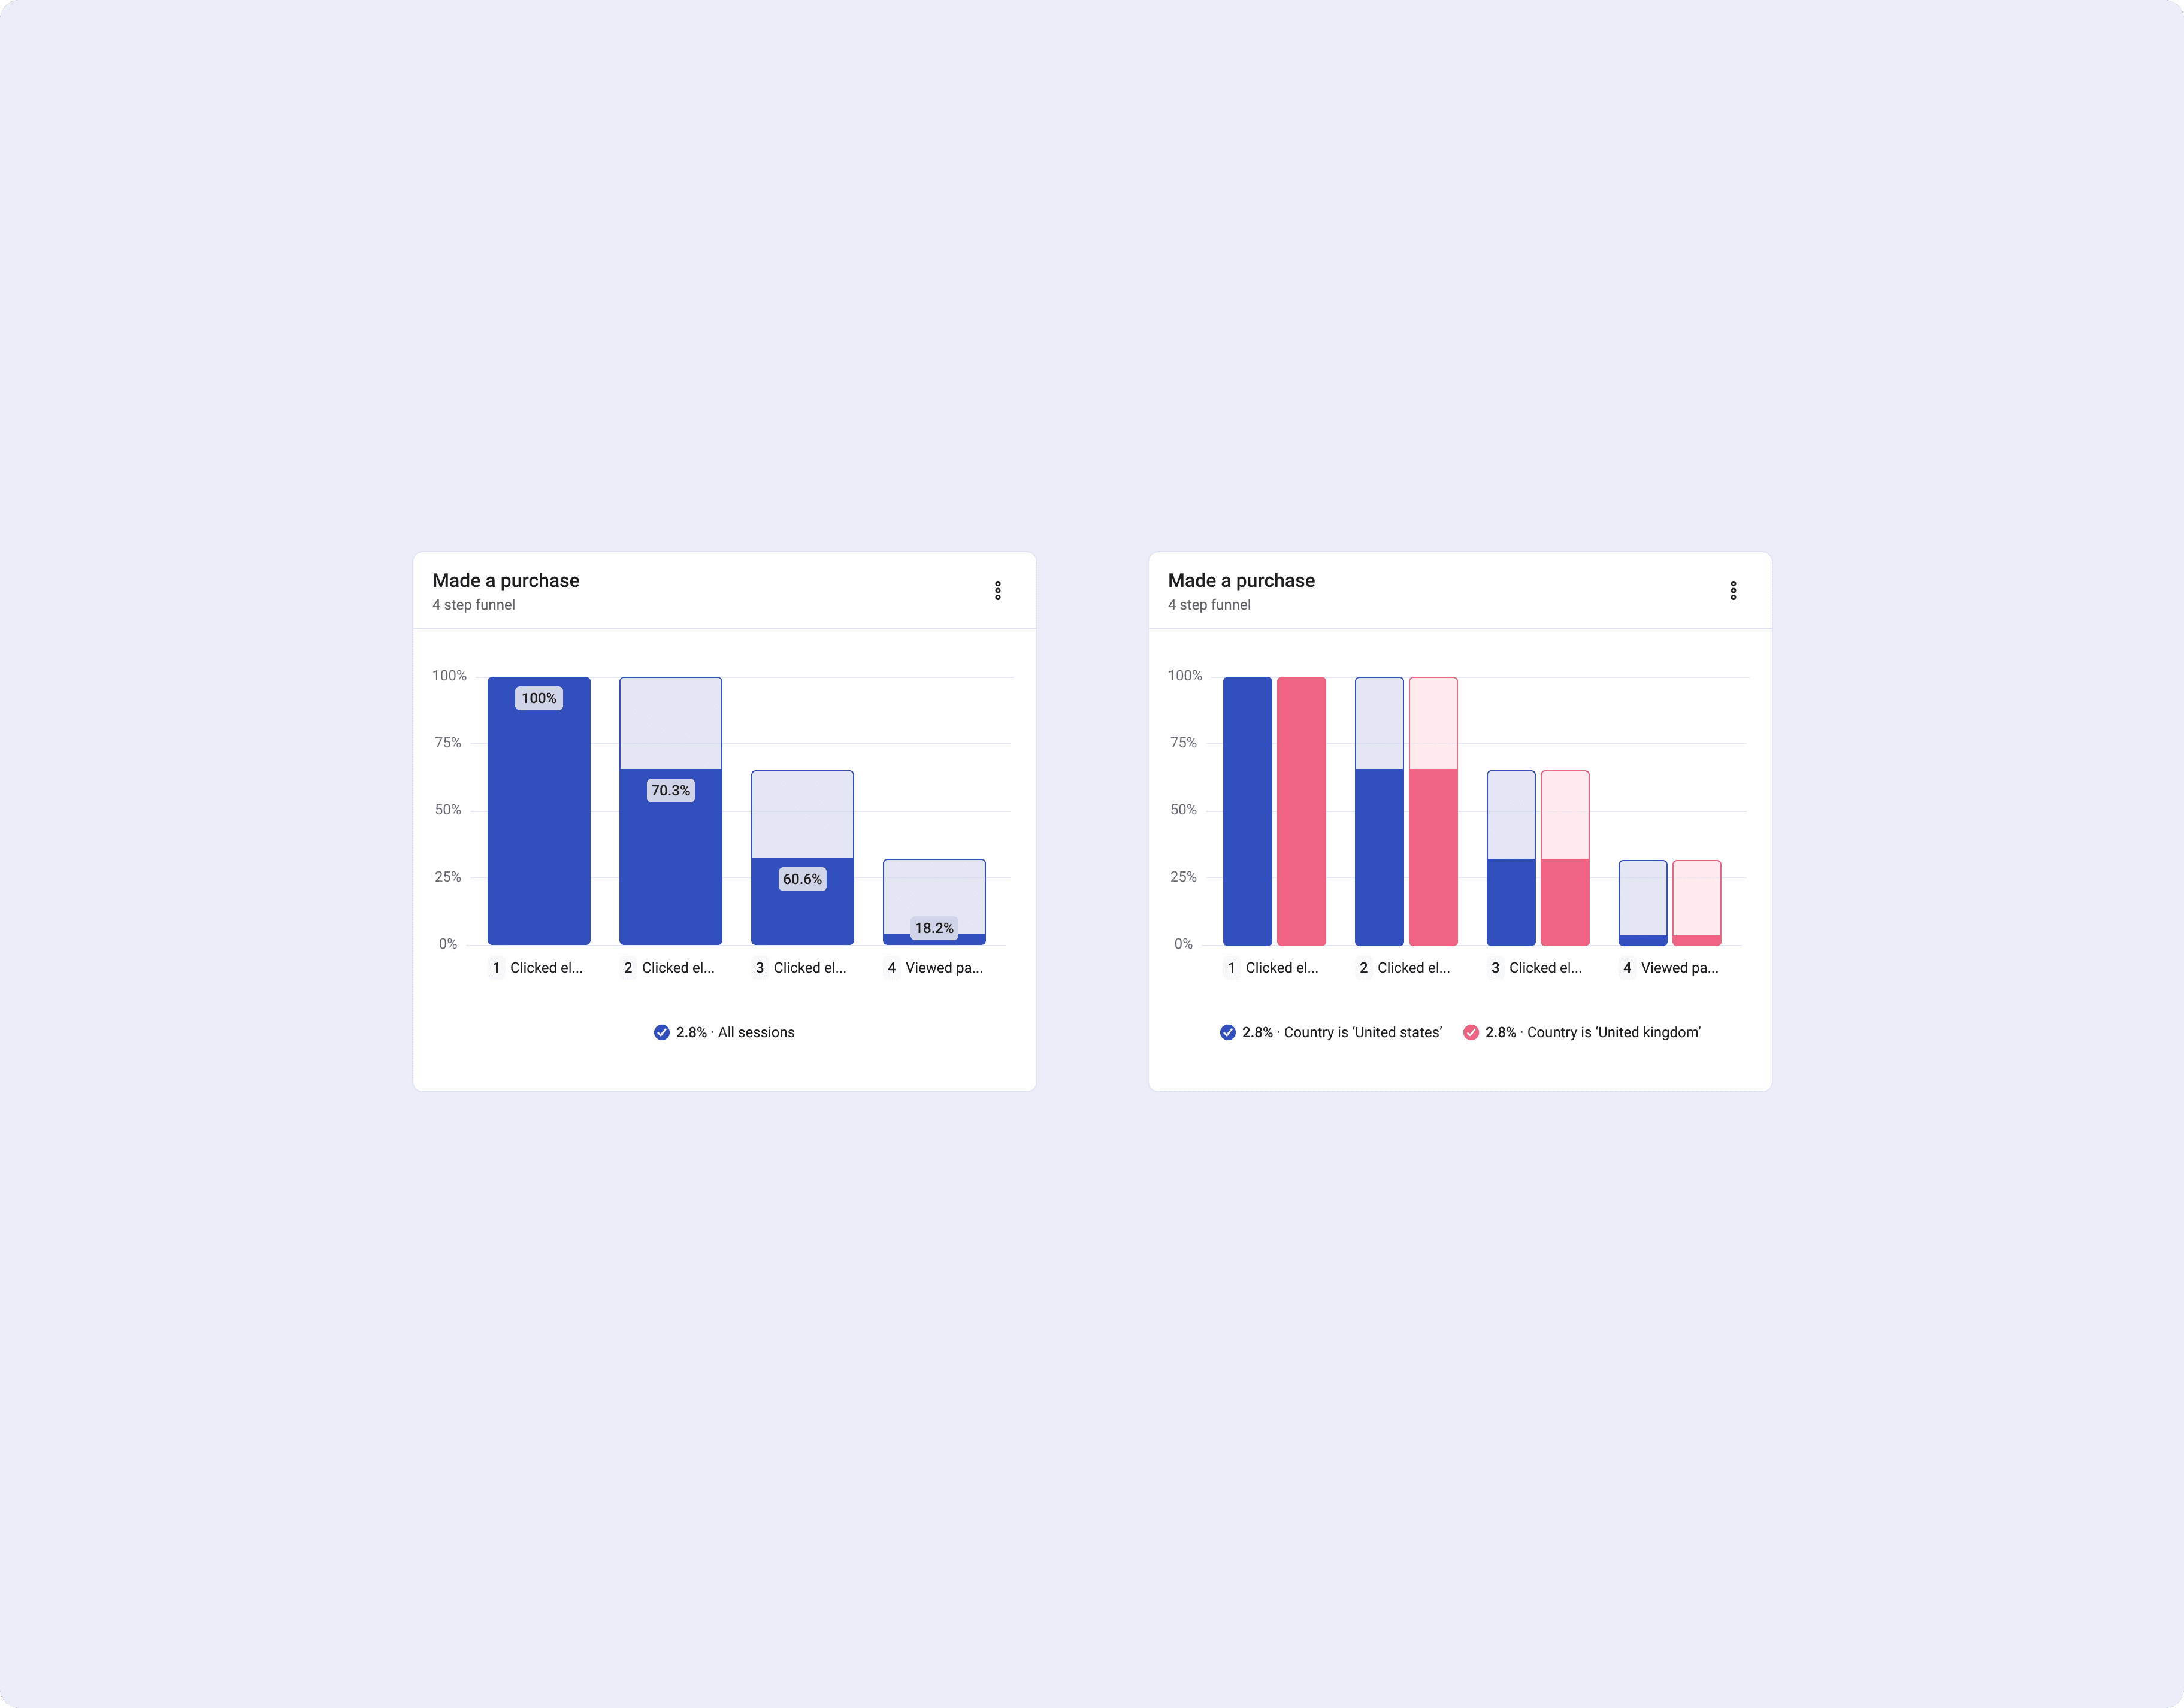
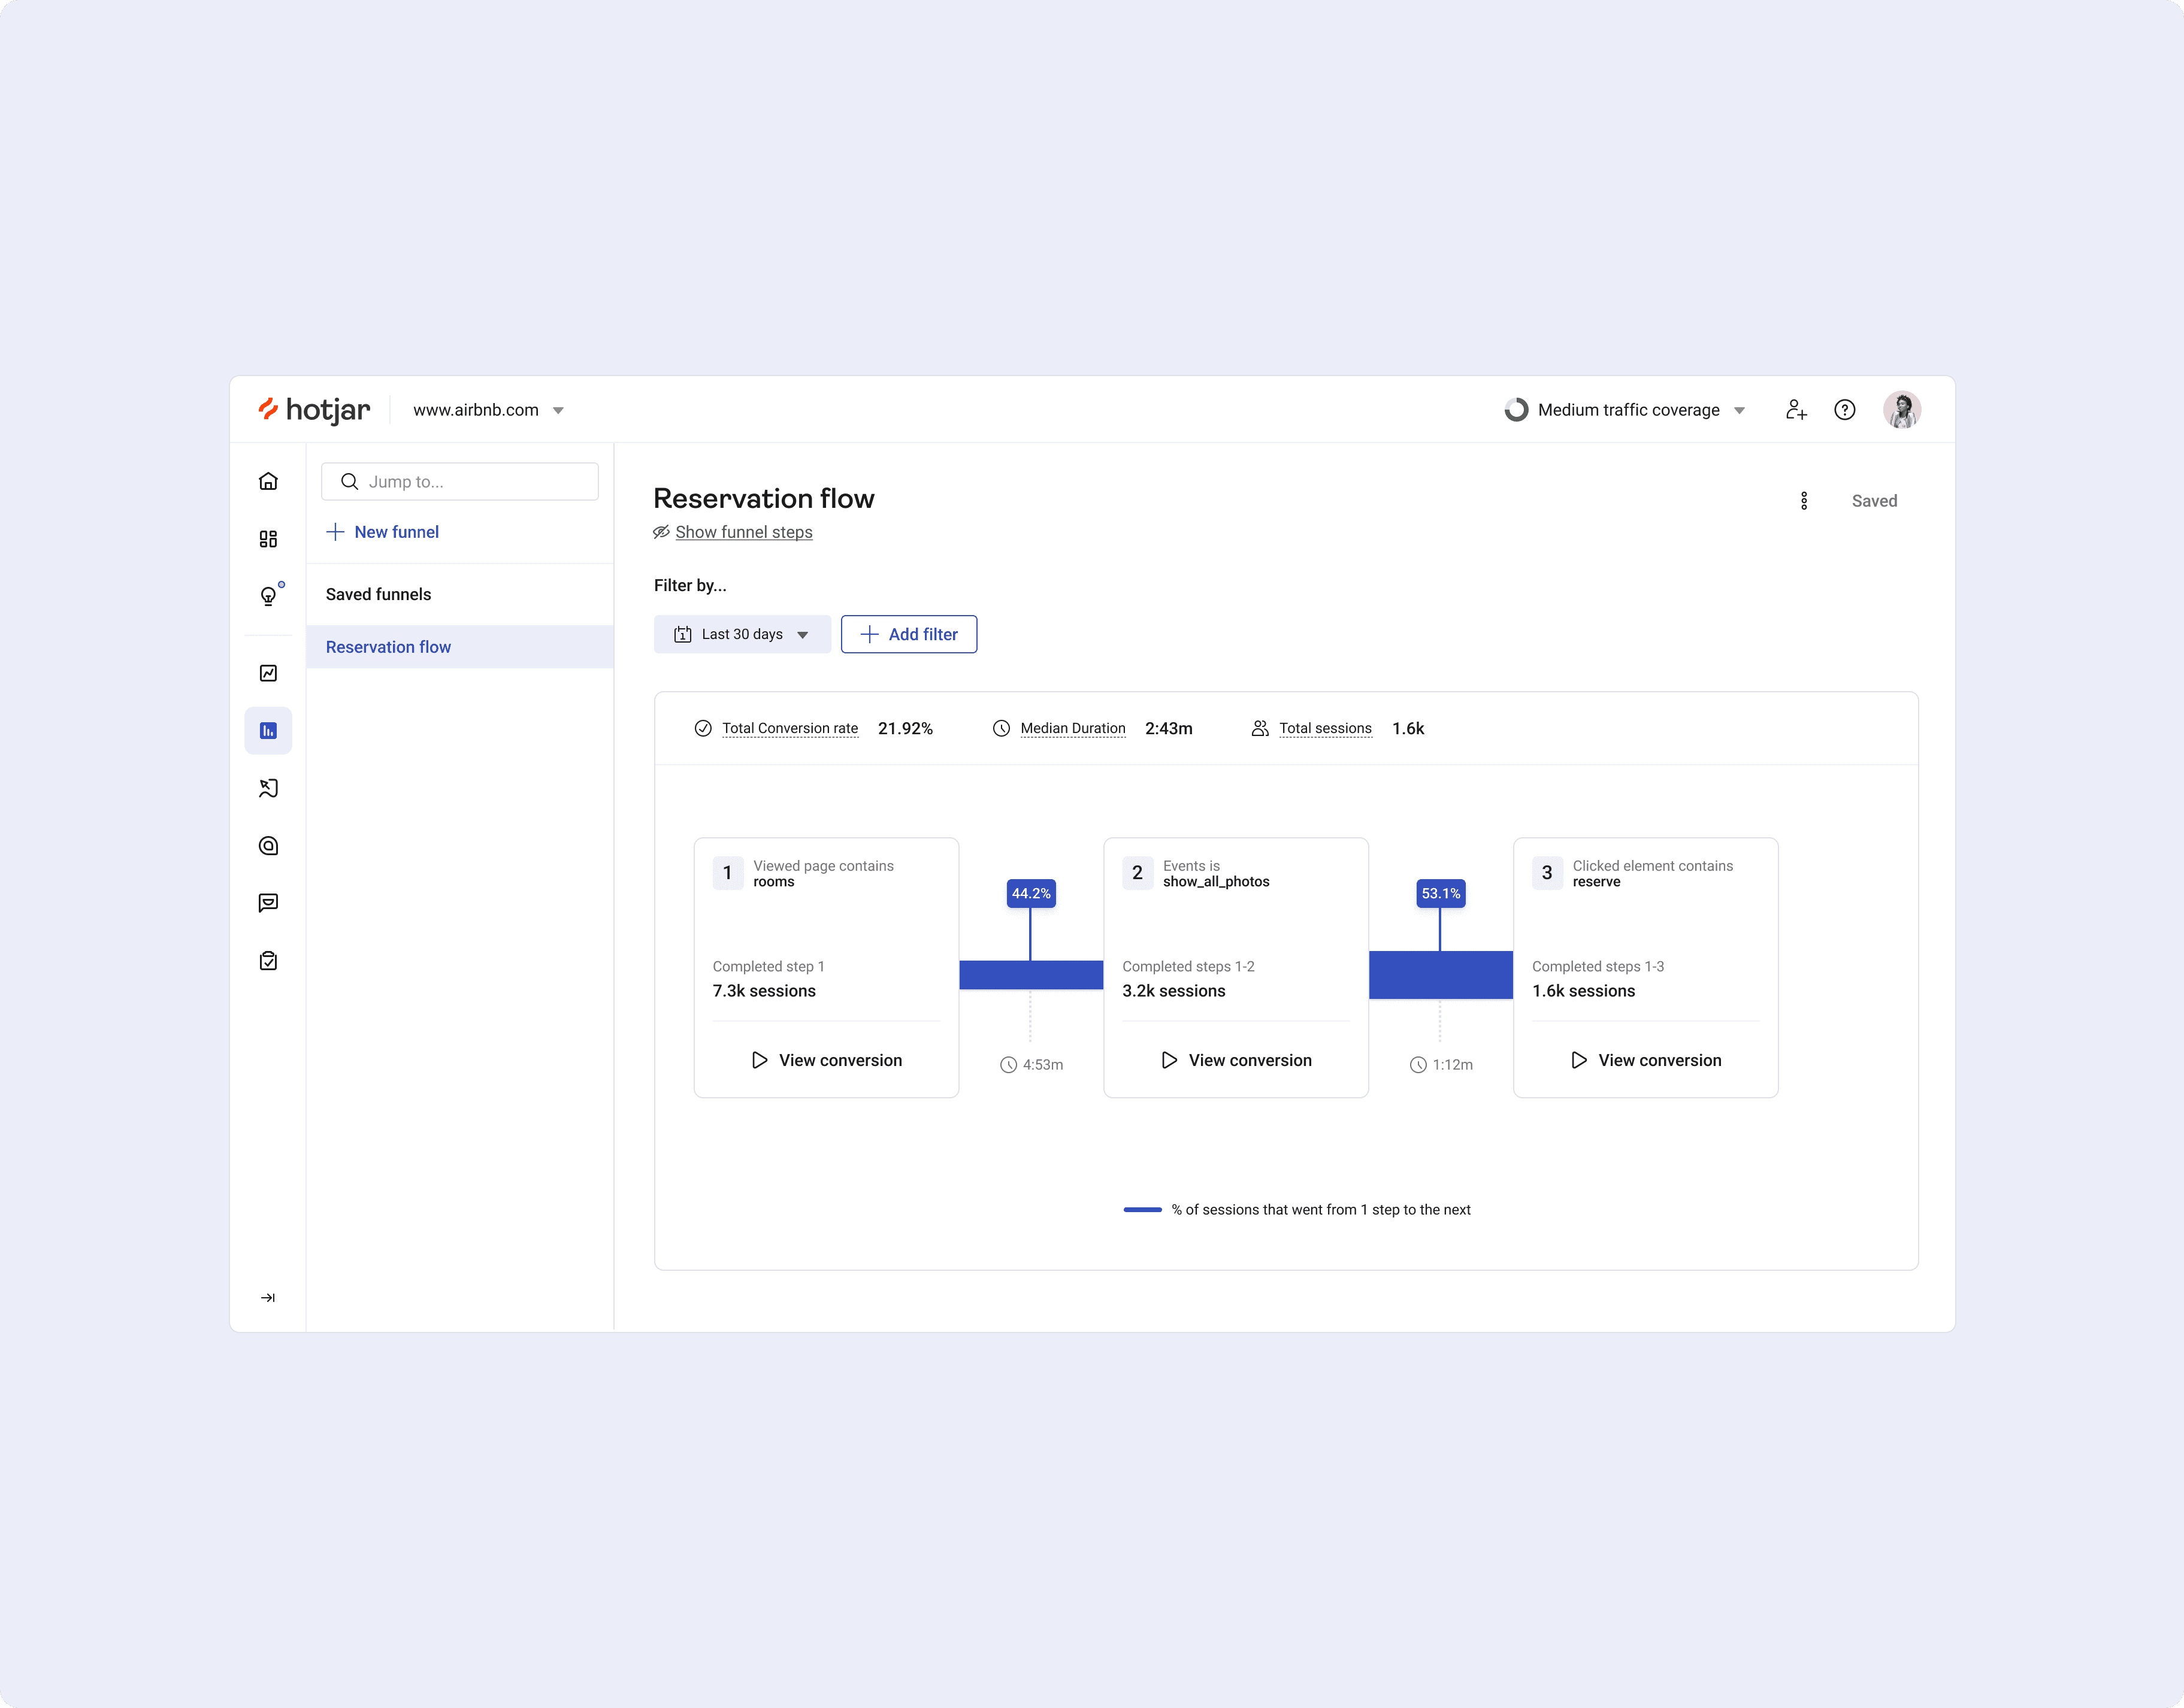
Funnels - Track Conversion Flows
Understand the real reason why users don’t convert. Funnels shows you where users drop off, along with the session recordings that help explain why.
With Funnels, you can:
Save your funnels to Dashboard to view them later
Compare conversion rates across audiences and filters
Visualize your funnels in different ways


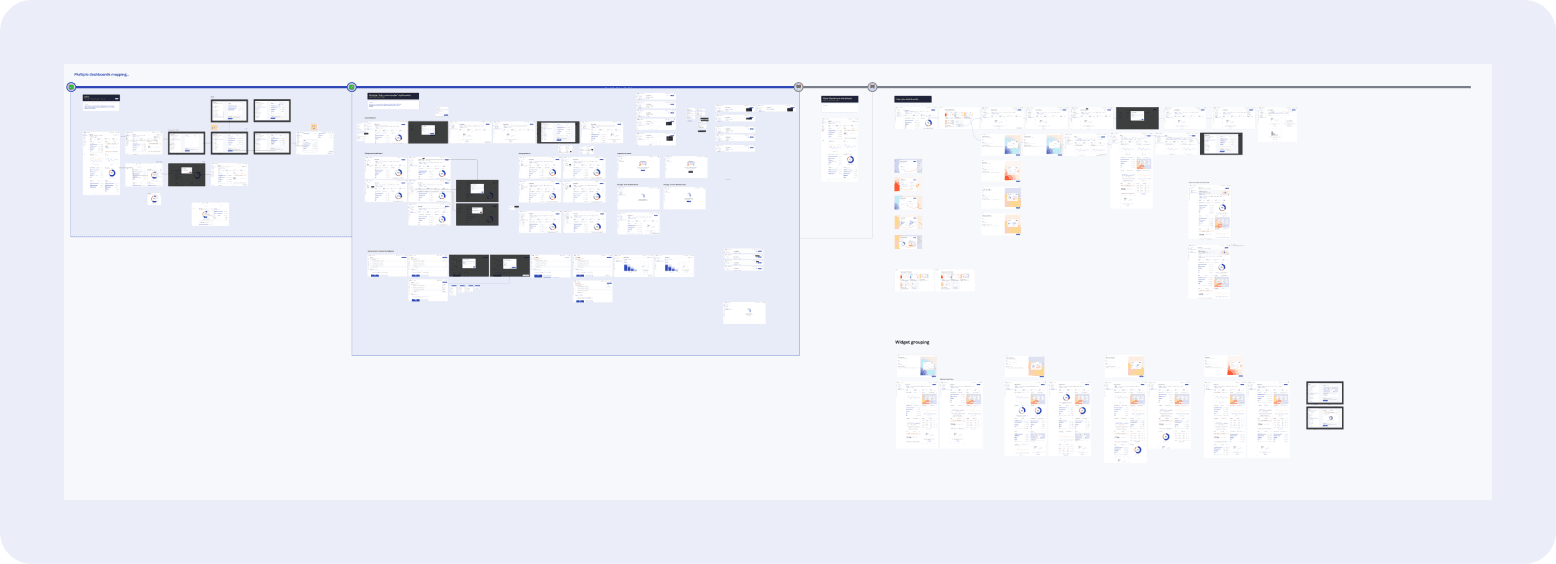
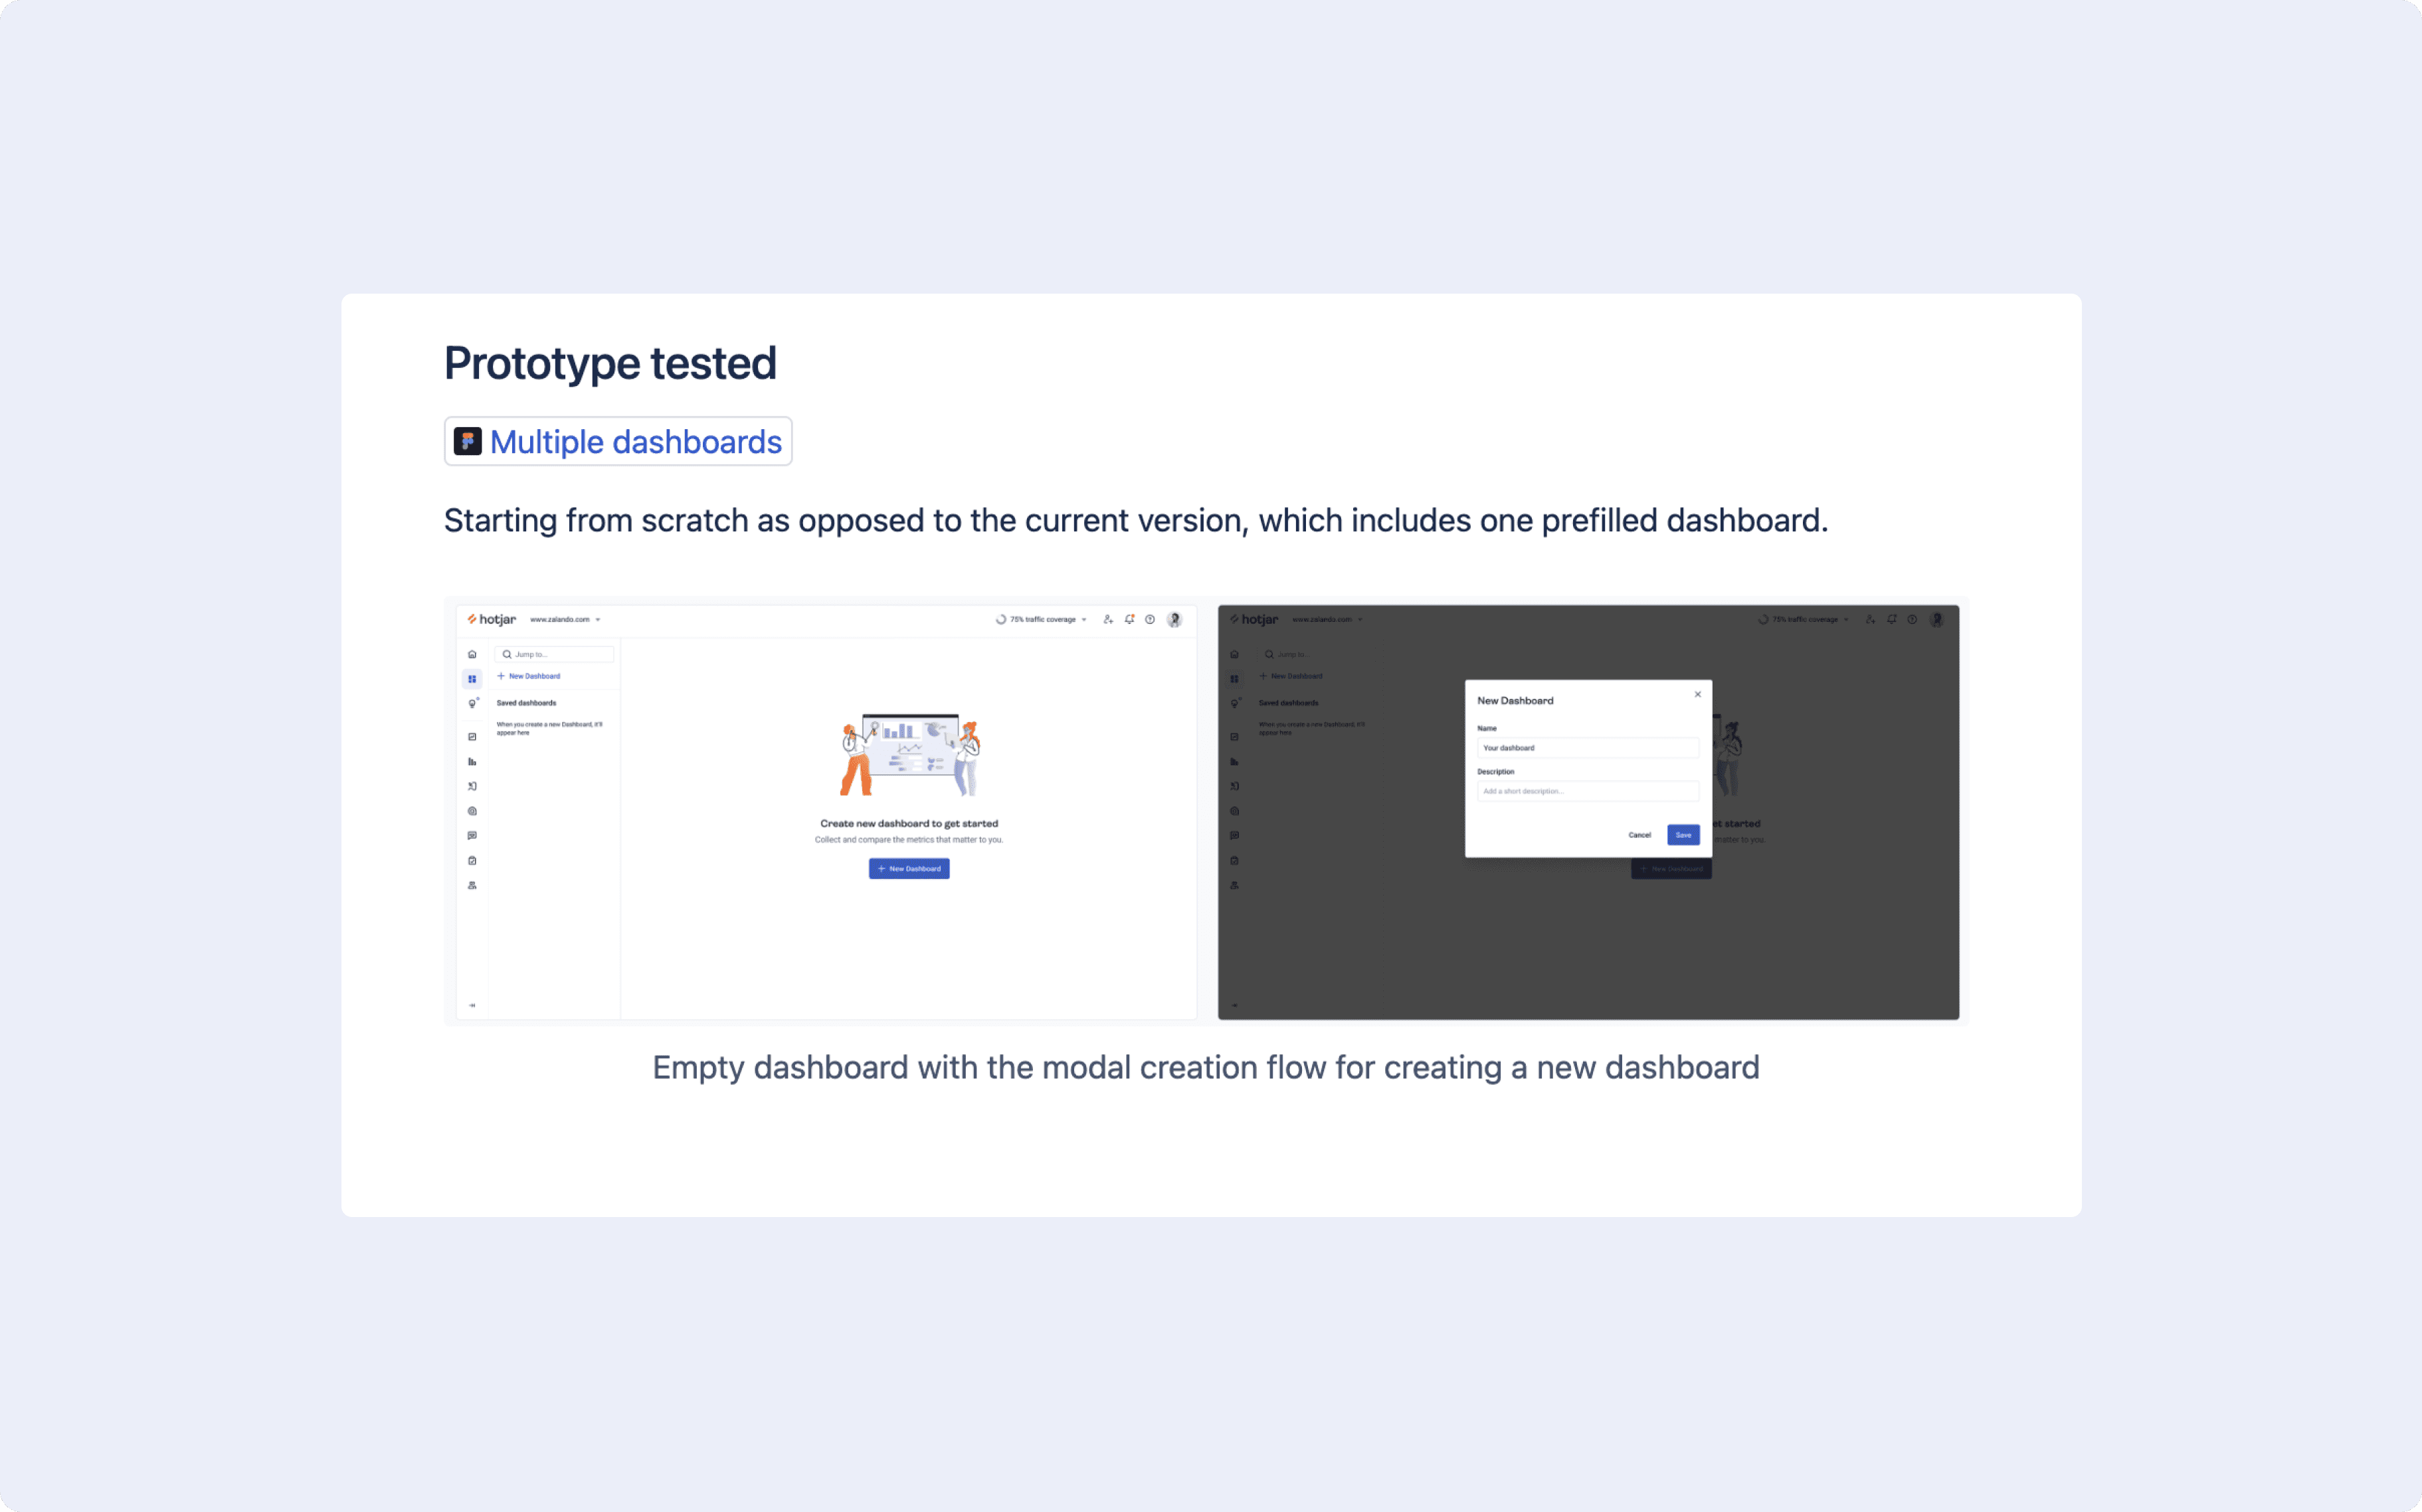
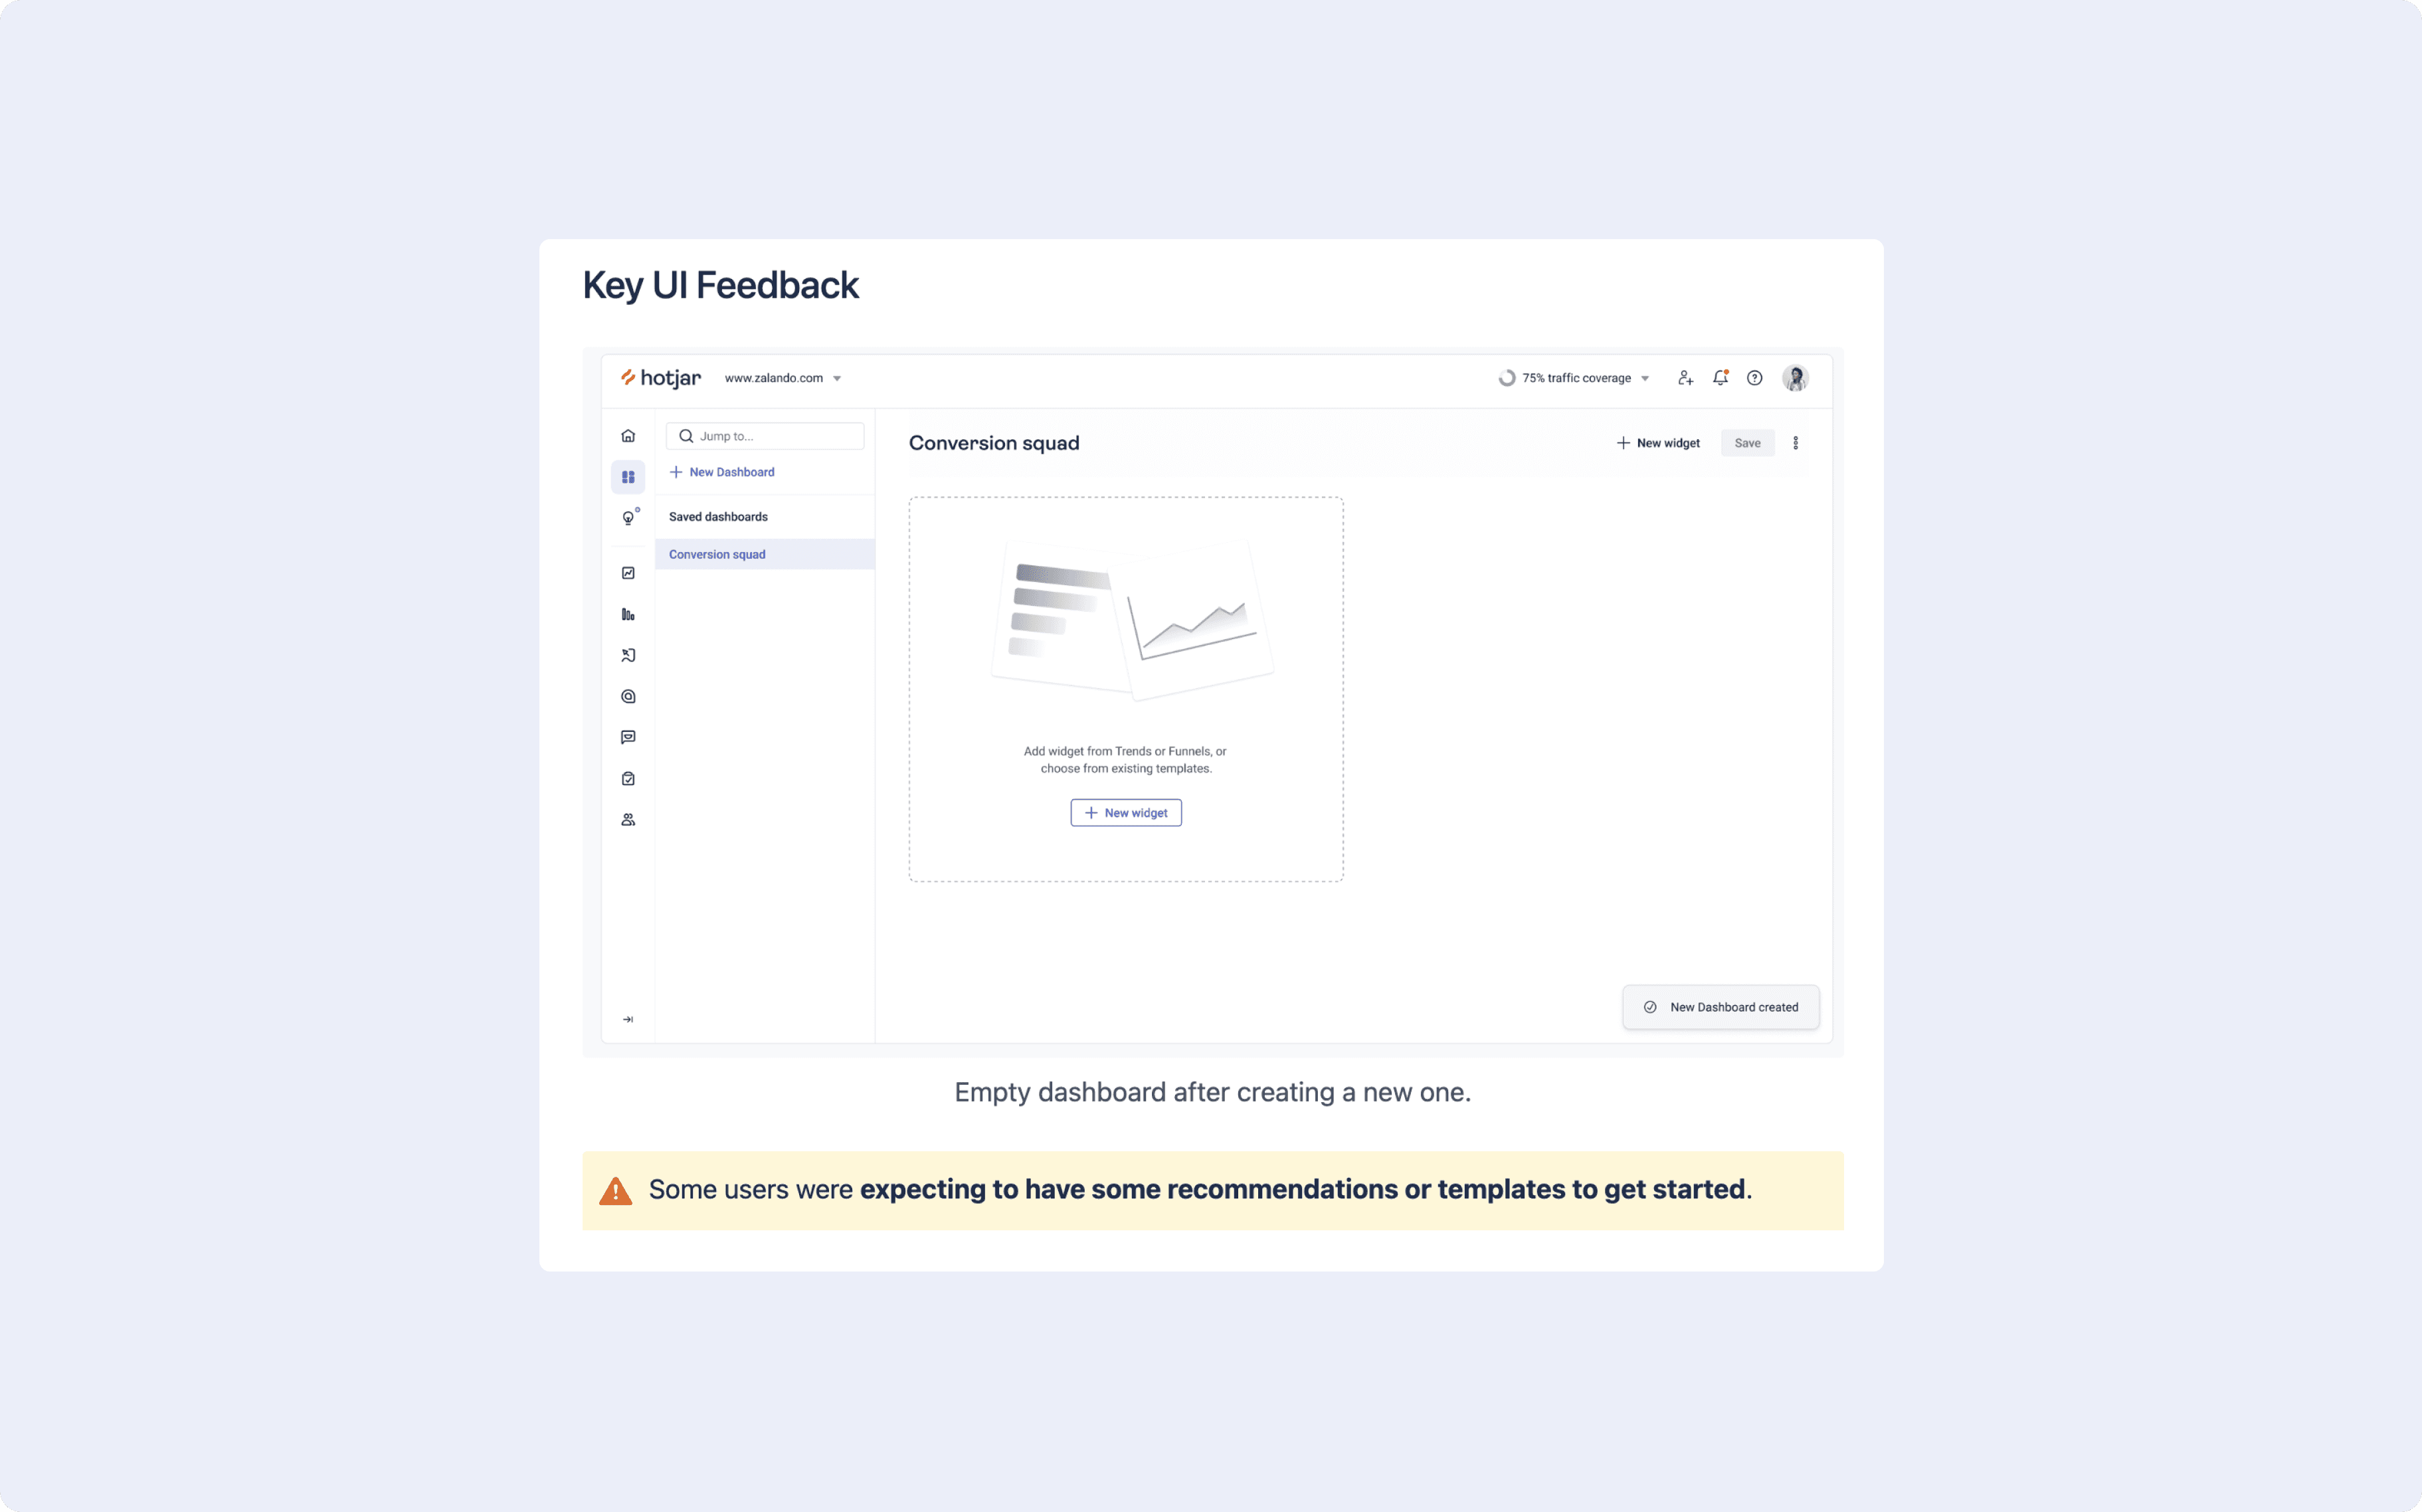
Multiple Dashboards
Users are able to create and customize as many dashboards as they need.
Validation Testing – MTP Multiple Dashboards
Research Objective: Evaluate the usability of the proposed prototype
Testing a Prototype/flow – How easy is it to create dashboards using the new flow?
The research phase included:
Included as part of our continuous weekly user interviews.

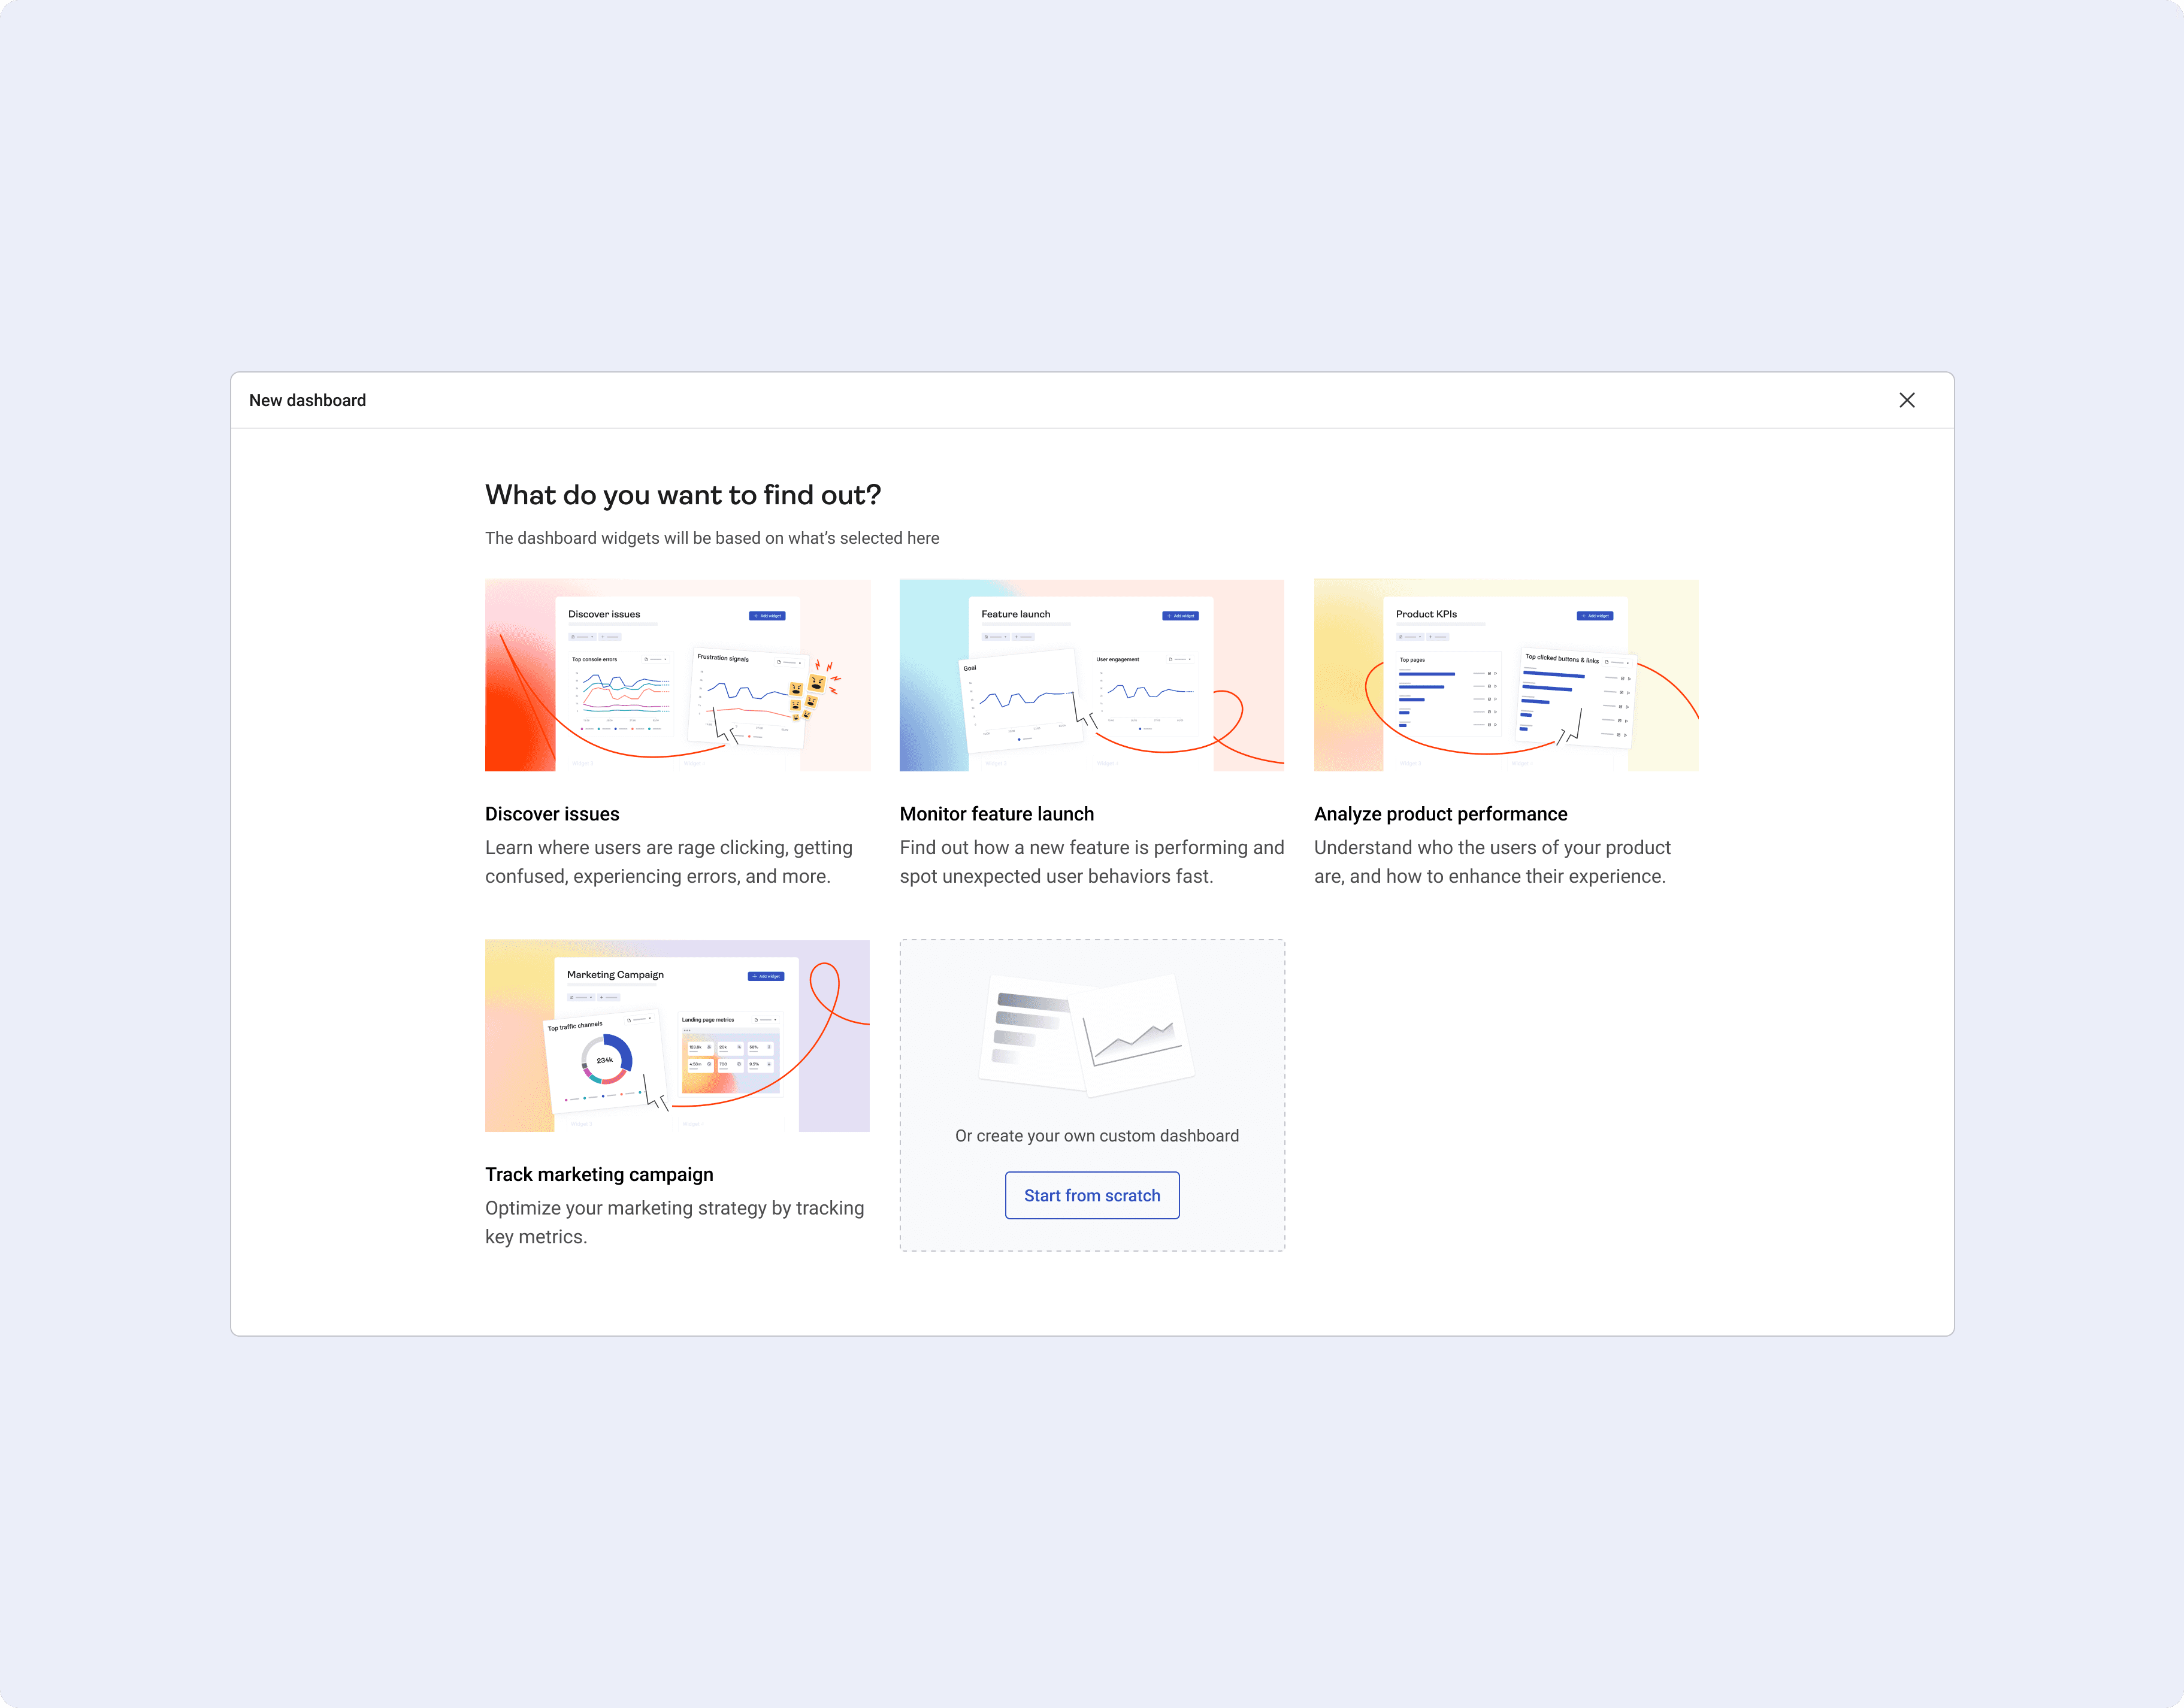
Use-case Dashboards
Guiding users with specific steps to streamline the process of creating a dashboard specific to their use-case.
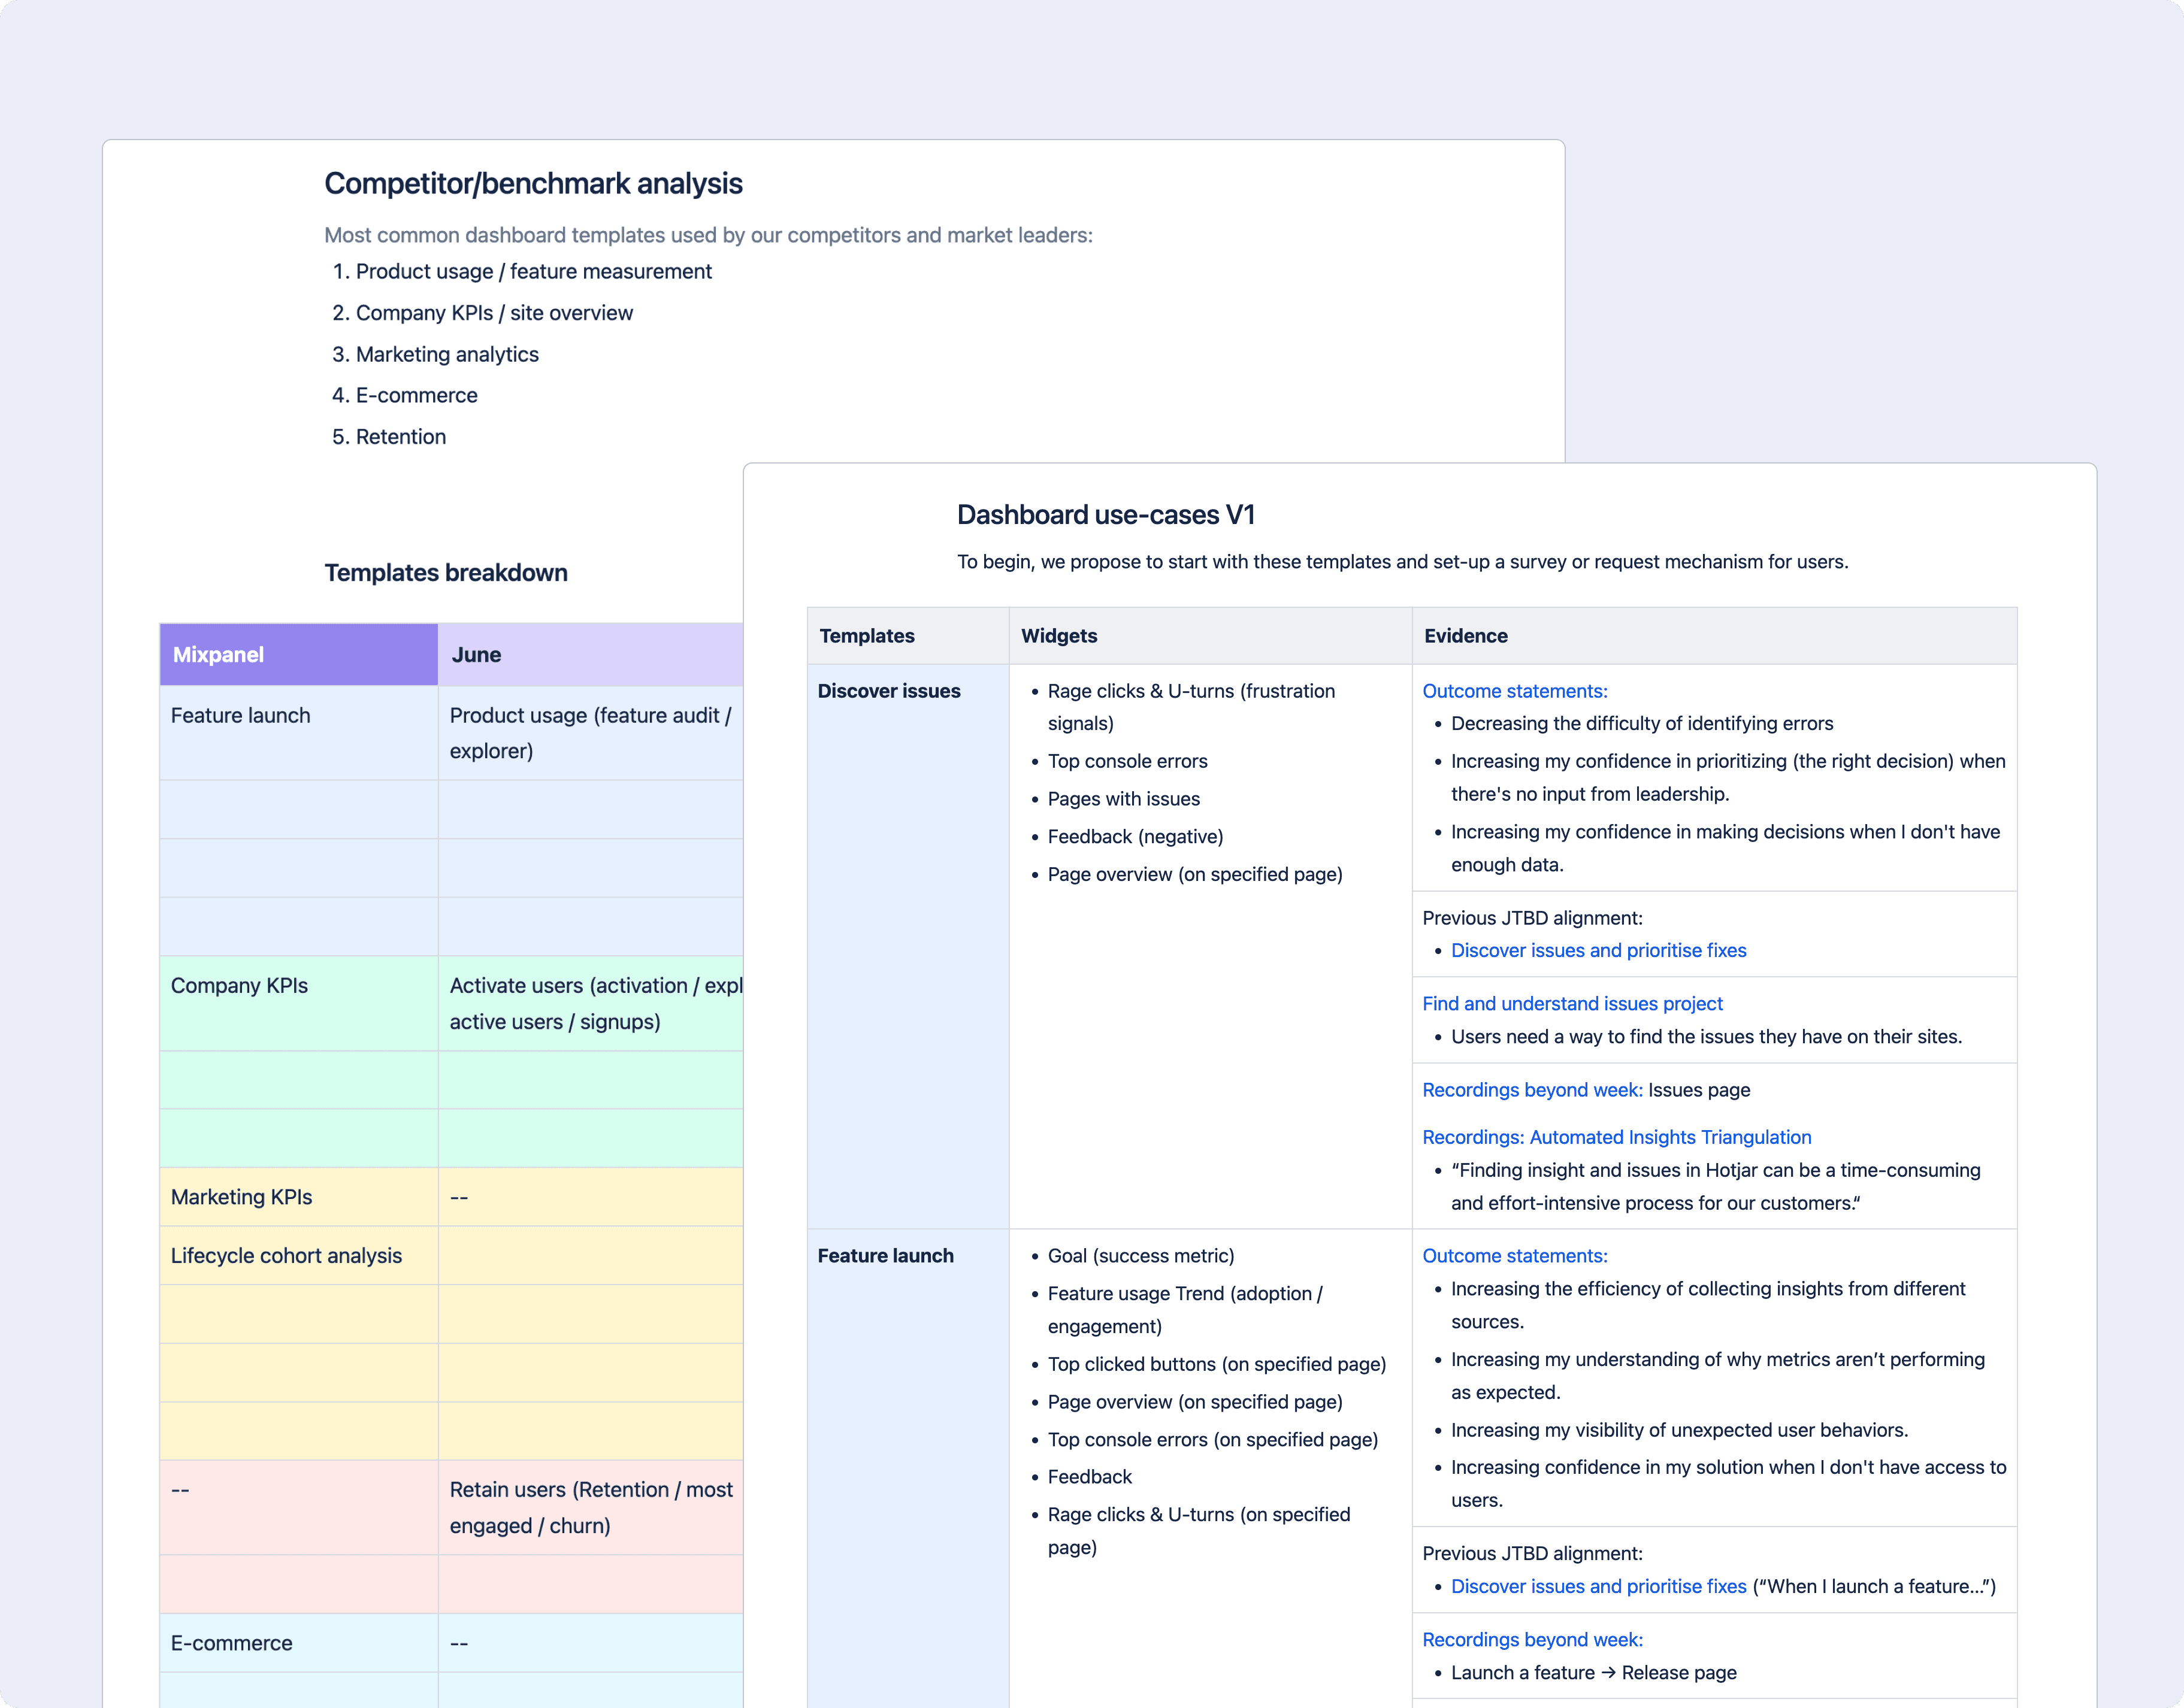
At Hotjar we use the jobs-to-be-done (JTBD) framework to help understand the customer's specific goal, or “job”, and the thorough process that would lead a customer to “hire” a product to complete the job.
We’ve used this framework to discover what our ICP [mid-market product teams] are actually trying to accomplish or achieve when they buy Hotjar.


AI Dashboard Visiontype
A major challenge for non-analytical users is to interpret the data. What does 20% mean? Is it a good thing?
Our goal was to simplify analytics in two ways:
Benchmarking – Benchmarking against the industry. As human beings comparison is a fundamental part of our behavior, driven by the need to evaluate ourselves against others.
Leverage generative AI to interpret the data we provide in order to help our users make better-informed decisions using the insights we provide.
The visiontype was there to set the product strategy for the upcoming quarters, however I left the company before this could be carried out.

Serves as a source of information and an action panel that allows the user to highlight or dig deeper into it through the connected tools.


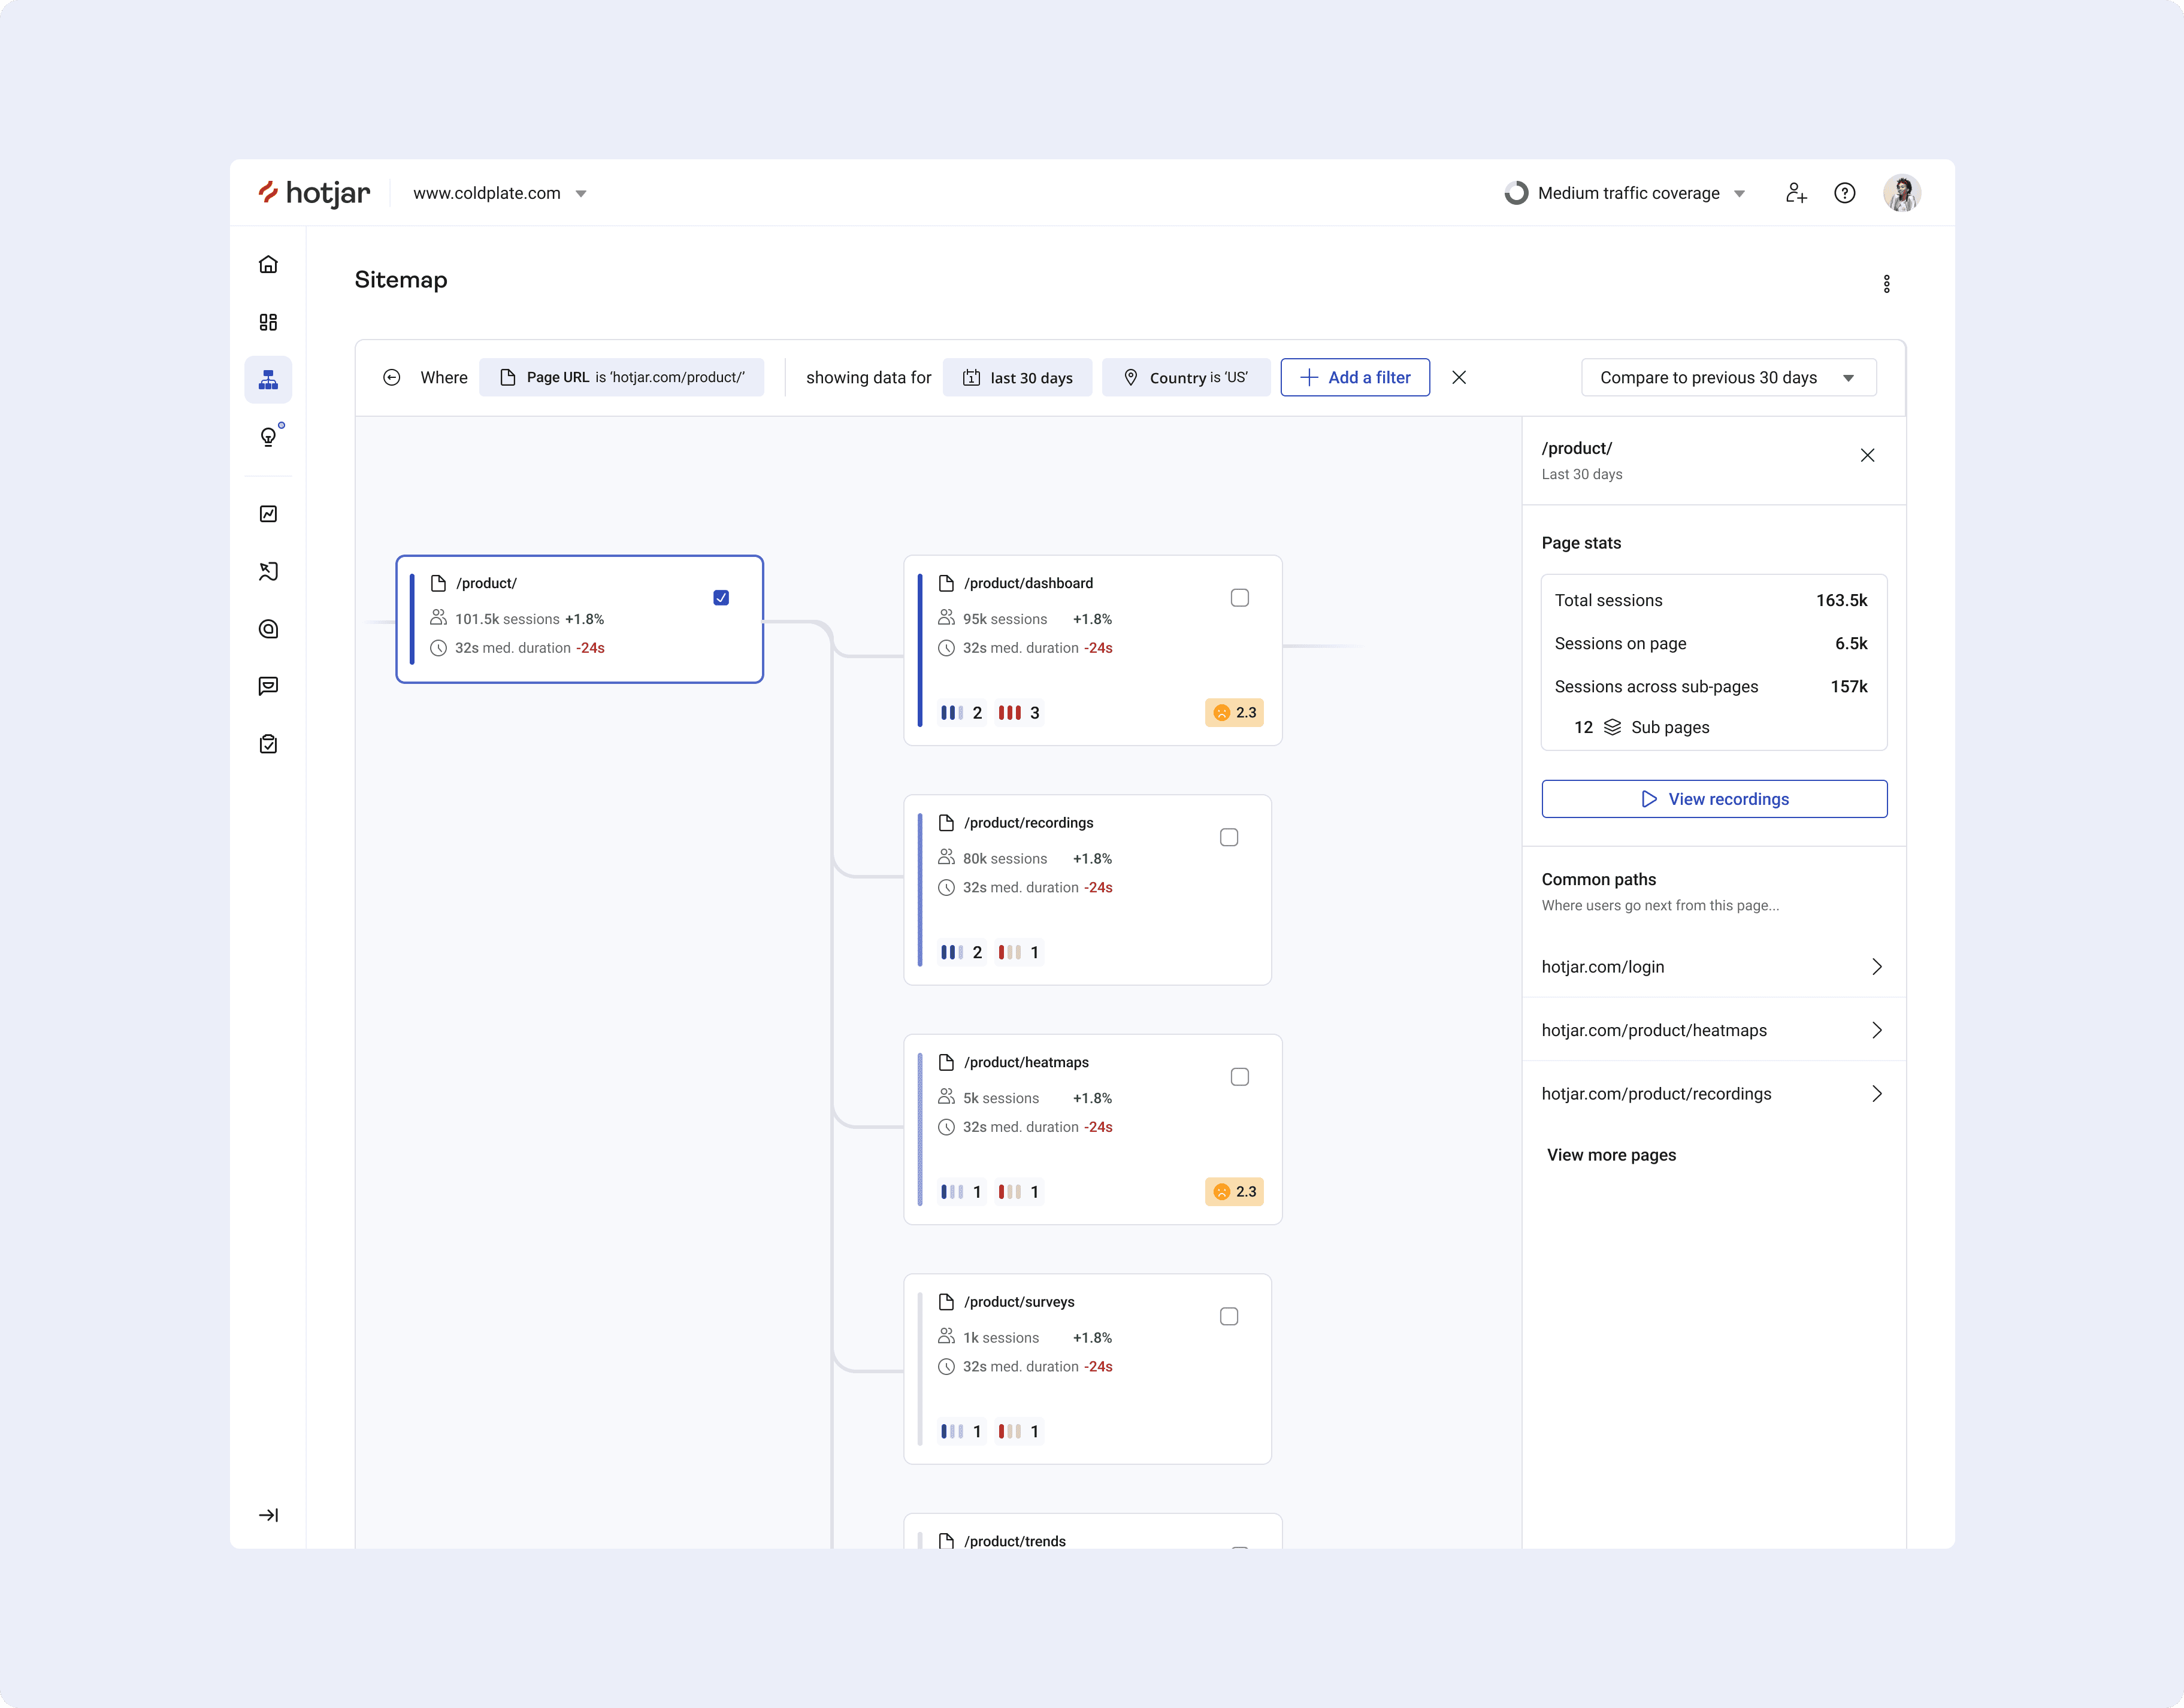
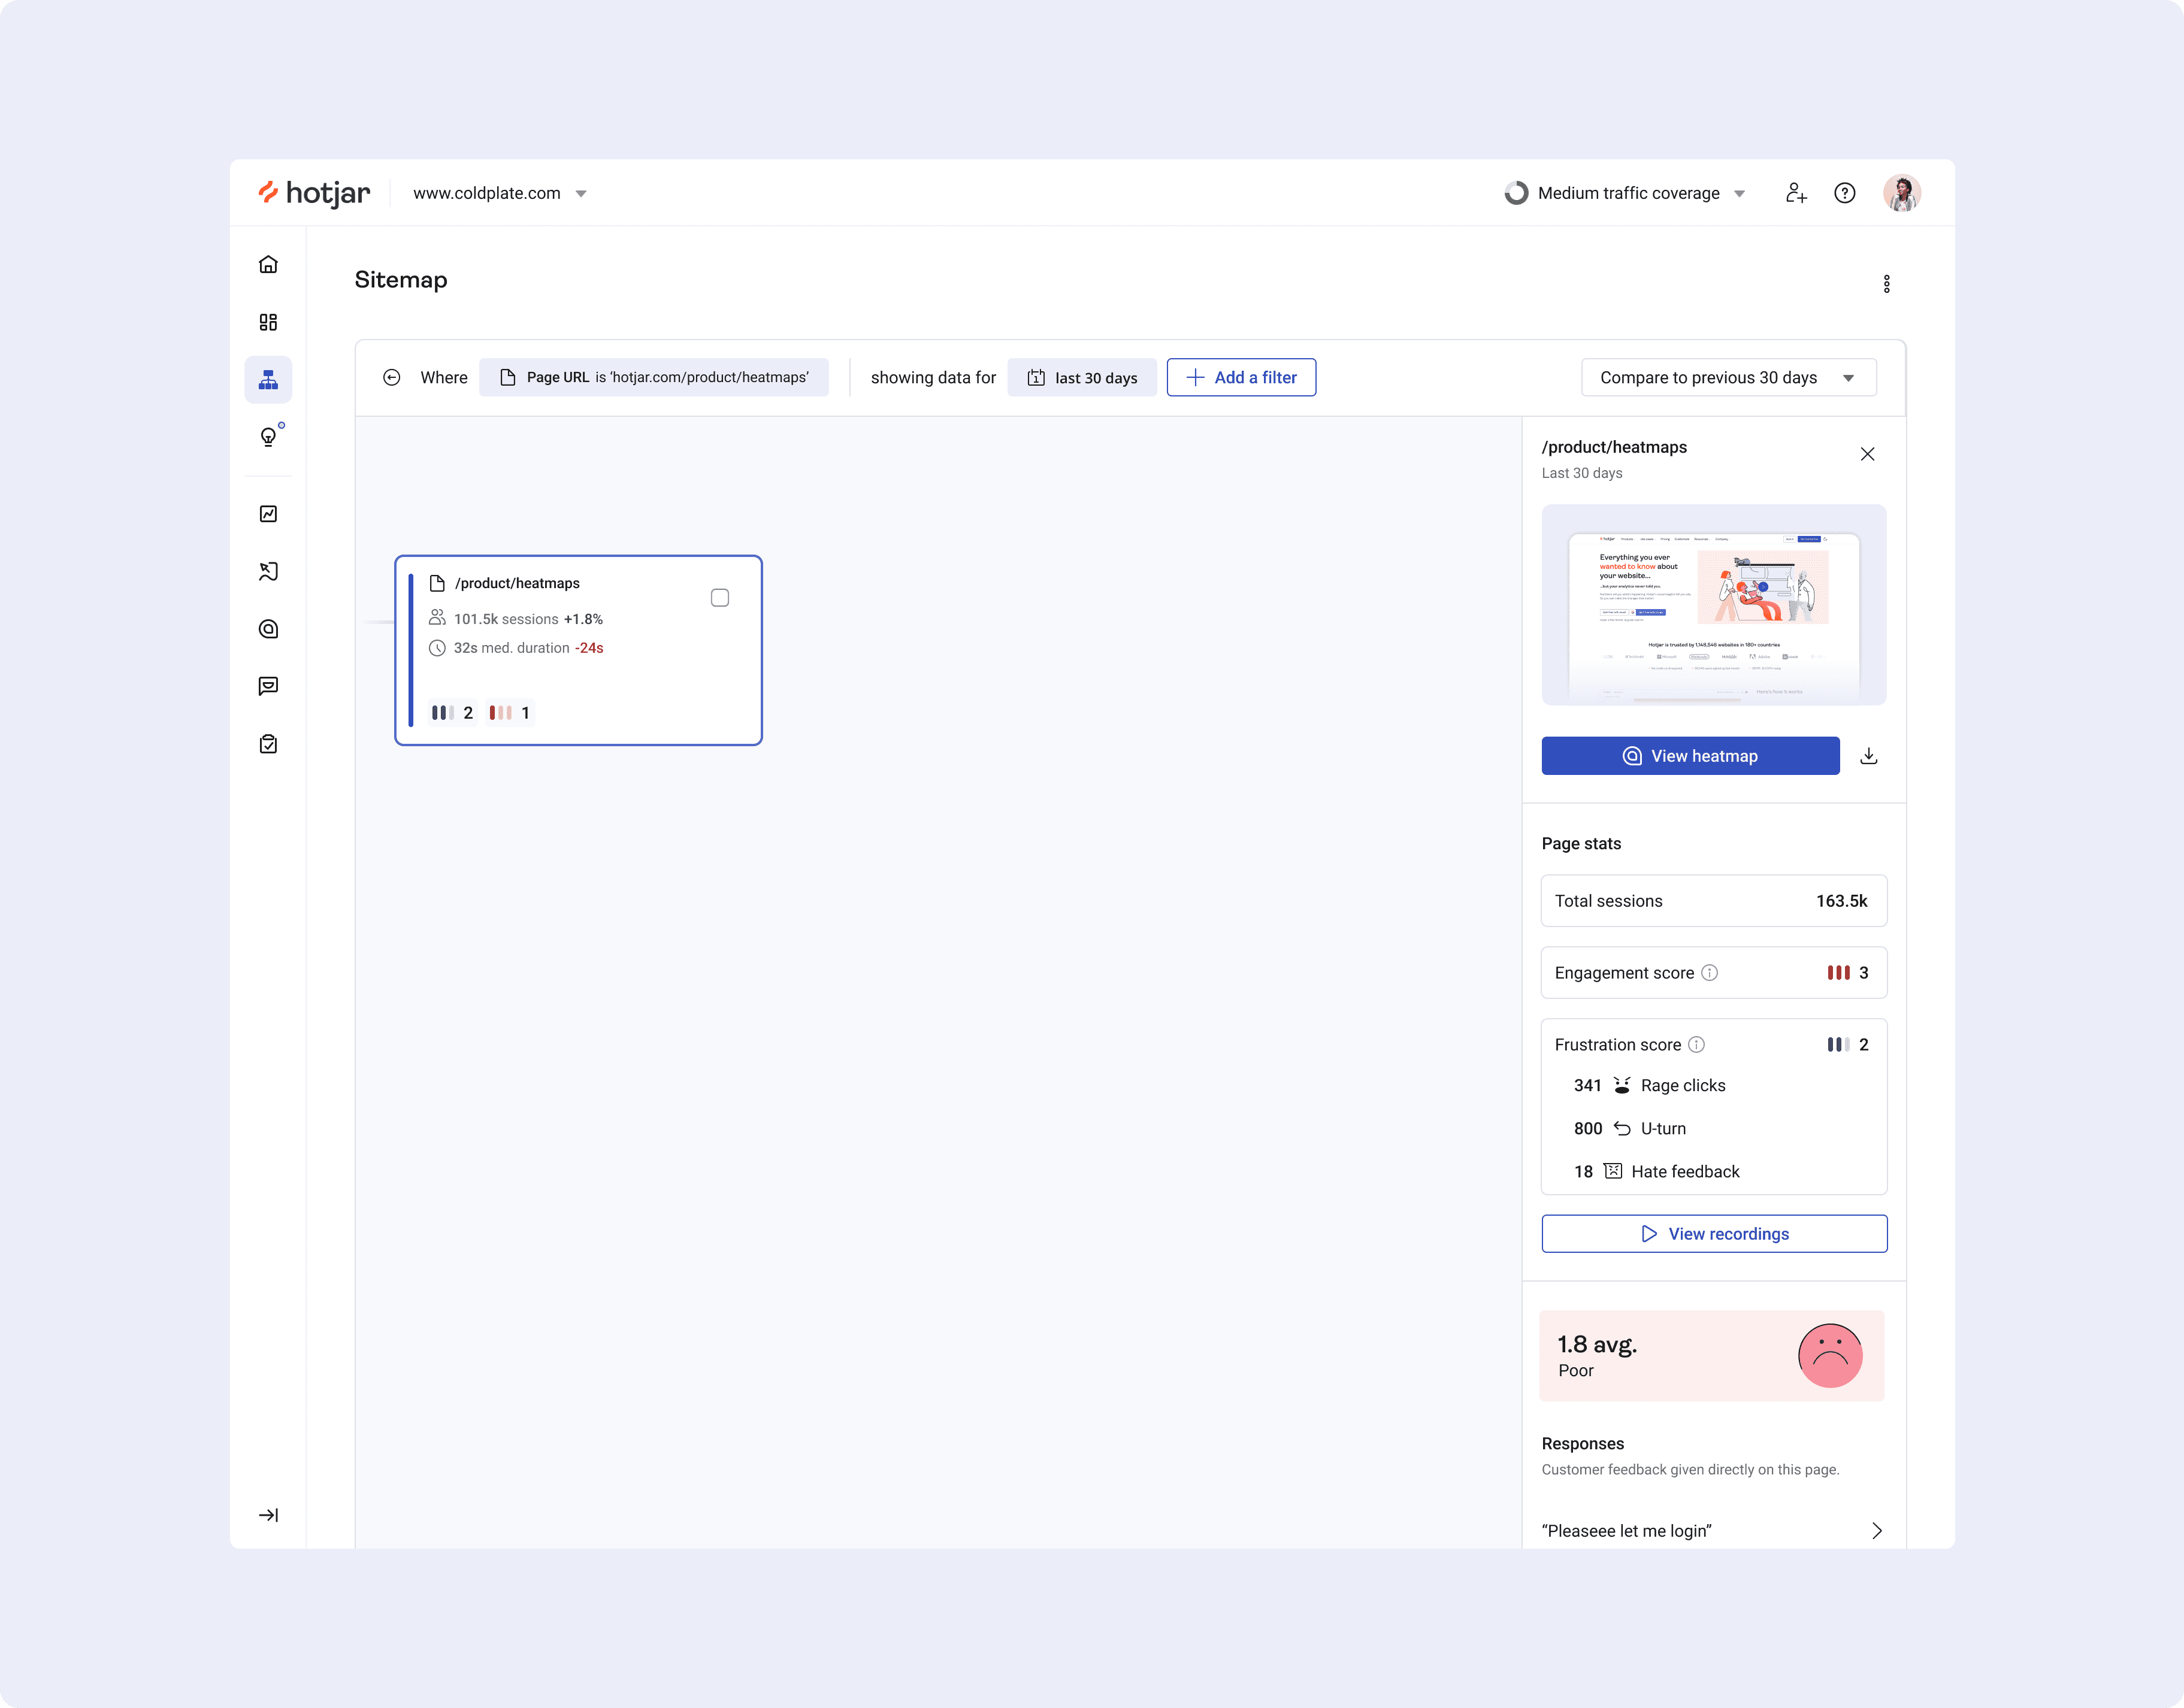
Sitemap Mapping
We explored a new way of having a high level view of a site as part of a hackathon.

Luke Causon 2025
Austria · Remote